BB&T 2013 Annual Report Download - page 109
Download and view the complete annual report
Please find page 109 of the 2013 BB&T annual report below. You can navigate through the pages in the report by either clicking on the pages listed below, or by using the keyword search tool below to find specific information within the annual report.-
 1
1 -
2
-
3
-
4
-
5
-
6
-
7
-
8
-
9
-
10
-
11
-
12
-
13
-
14
-
15
-
16
-
17
-
18
-
19
-
20
-
21
-
22
-
23
-
24
-
25
-
26
-
27
-
28
-
29
-
30
-
31
-
32
-
33
-
34
-
35
-
36
-
37
-
38
-
39
-
40
-
41
-
42
-
43
-
44
-
45
-
46
-
47
-
48
-
49
-
50
-
51
-
52
-
53
-
54
-
55
-
56
-
57
-
58
-
59
-
60
-
61
-
62
-
63
-
64
-
65
-
66
-
67
-
68
-
69
-
70
-
71
-
72
-
73
-
74
-
75
-
76
-
77
-
78
-
79
-
80
-
81
-
82
-
83
-
84
-
85
-
86
-
87
-
88
-
89
-
90
-
91
-
92
-
93
-
94
-
95
-
96
-
97
-
98
-
 99
99 -
 100
100 -
 101
101 -
 102
102 -
 103
103 -
 104
104 -
 105
105 -
 106
106 -
 107
107 -
 108
108 -
 109
109 -
 110
110 -
 111
111 -
 112
112 -
 113
113 -
 114
114 -
 115
115 -
 116
116 -
 117
117 -
 118
118 -
 119
119 -
120
-
121
-
122
-
123
-
124
-
125
-
126
-
127
-
128
-
129
-
130
-
131
-
132
-
133
-
134
-
135
-
136
-
137
-
138
-
139
-
140
-
141
-
142
-
143
-
144
-
145
-
146
-
147
-
148
-
149
-
150
-
151
-
152
-
153
-
154
-
155
-
156
-
157
-
158
 |
 |

109
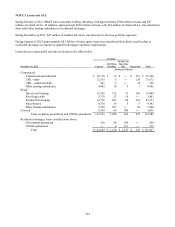
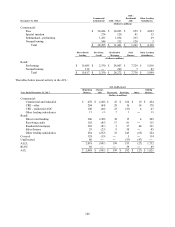
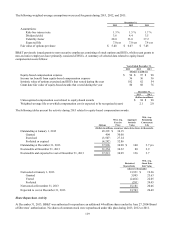
Average Interest
Recorded Related Recorded Income
As Of / For The Year Ended December 31, 2012 Investment UPB ALLL Investment Recognized
(Dollars in millions)
With no related ALLL recorded:
Commercial:
Commercial and industrial $ 116 $ 232 $ ― $ 117 $ ―
CRE - other 60 108 ― 81 ―
CRE - residential ADC 44 115 ― 103 ―
Retail:
Direct retail lending 19 73 ― 19 1
Residential mortgage (1) 120 201 ― 80 2
Sales finance 1 3 ― 1 ―
Other lending subsidiaries 2 6 ― 3 ―
With an ALLL recorded:
Commercial:
Commercial and industrial 515 551 73 522 3
CRE - other 252 255 36 319 5
CRE - residential ADC 111 116 21 180 1
Other lending subsidiaries 3 3 1 4 ―
Retail:
Direct retail lending 216 226 59 140 9
Revolving credit 56 56 24 59 2
Residential mortgage (1) 754 770 104 649 28
Sales finance 21 21 6 13 ―
Other lending subsidiaries 144 146 61 66 2
Total (1) $ 2,434 $ 2,882 $ 385 $ 2,356 $ 53
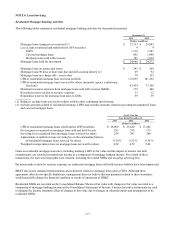
(1) Residential mortgage loans exclude $376 million and $313 million in government guaranteed loans and related
ALLL of $55 million and $26 million as of December 31, 2013 and December 31, 2012, respectively.
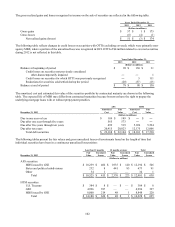
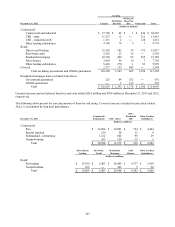
The following table provides a summary of TDRs, all of which are considered impaired.
December 31,
2013 2012
(Dollars in millions)
Performing TDRs:
Commercial:
Commercial and industrial $ 77 $ 77
CRE - other 70 67
CRE - residential ADC 19 21
Direct retail lending 187 197
Sales finance 17 19
Revolving credit 48 56
Residential mortgage 785 769
Other lending subsidiaries 126 121
Total performing TDRs 1,329 1,327
N
onperforming TDRs (also included in NPL disclosures) 193 240
Total TDRs $ 1,522 $ 1,567
ALLL attributable to TDRs, excluding government guaranteed $ 228 $ 281
Government guaranteed residential mortgage TDRs excluded from above table:
Held for investment $ 376 $ 313
Held for sale 3 2