BB&T 2013 Annual Report Download - page 105
Download and view the complete annual report
Please find page 105 of the 2013 BB&T annual report below. You can navigate through the pages in the report by either clicking on the pages listed below, or by using the keyword search tool below to find specific information within the annual report.-
 1
1 -
2
-
3
-
4
-
5
-
6
-
7
-
8
-
9
-
10
-
11
-
12
-
13
-
14
-
15
-
16
-
17
-
18
-
19
-
20
-
21
-
22
-
23
-
24
-
25
-
26
-
27
-
28
-
29
-
30
-
31
-
32
-
33
-
34
-
35
-
36
-
37
-
38
-
39
-
40
-
41
-
42
-
43
-
44
-
45
-
46
-
47
-
48
-
49
-
50
-
51
-
52
-
53
-
54
-
55
-
56
-
57
-
58
-
59
-
60
-
61
-
62
-
63
-
64
-
65
-
66
-
67
-
68
-
69
-
70
-
71
-
72
-
73
-
74
-
75
-
76
-
77
-
78
-
79
-
80
-
81
-
82
-
83
-
84
-
85
-
86
-
87
-
88
-
89
-
90
-
91
-
92
-
93
-
94
-
 95
95 -
 96
96 -
 97
97 -
 98
98 -
 99
99 -
 100
100 -
 101
101 -
 102
102 -
 103
103 -
 104
104 -
 105
105 -
 106
106 -
 107
107 -
 108
108 -
 109
109 -
 110
110 -
 111
111 -
 112
112 -
 113
113 -
 114
114 -
 115
115 -
116
-
117
-
118
-
119
-
120
-
121
-
122
-
123
-
124
-
125
-
126
-
127
-
128
-
129
-
130
-
131
-
132
-
133
-
134
-
135
-
136
-
137
-
138
-
139
-
140
-
141
-
142
-
143
-
144
-
145
-
146
-
147
-
148
-
149
-
150
-
151
-
152
-
153
-
154
-
155
-
156
-
157
-
158
 |
 |

105
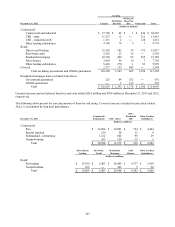
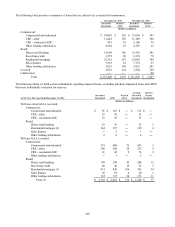
Accruing
90 Days Or
30-89 Days More Past
December 31, 2012 Current Past Due Due Nonaccrual Total
(Dollars in millions)
Commercial:
Commercial and industrial $ 37,706 $ 42 $ 1 $ 546 $ 38,295
CRE - other 11,237 12 ― 212 11,461
CRE - residential ADC 1,131 2 ― 128 1,261
Other lending subsidiaries 4,106 20 9 3 4,138
Retail:
Direct retail lending 15,502 145 38 132 15,817
Revolving credit 2,291 23 16 ― 2,330
Residential mortgage 22,330 498 92 269 23,189
Sales finance 7,663 56 10 7 7,736
Other lending subsidiaries 5,645 270 1 83 5,999
Covered 2,717 135 442 ― 3,294
Total excluding government and GNMA guaranteed 110,328 1,203 609 1,380 113,520
Residential mortgage loans excluded from above:
Government guaranteed 225 84 252 ― 561
GNMA guaranteed ― 5 517 ― 522
Total $ 110,553 $ 1,292 $ 1,378 $ 1,380 $ 114,603
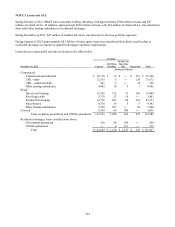
Unearned income and net deferred loan fees and costs totaled $261 million and $308 million at December 31, 2013 and 2012,
respectively.
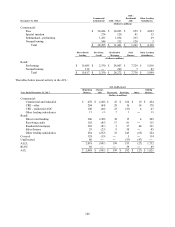
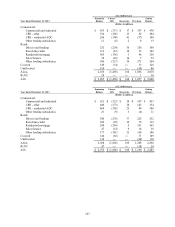
The following tables present the carrying amount of loans by risk rating. Covered loans are excluded because their related
ALLL is determined by loan pool performance.
CRE -
Commercial Residential Other Lending
December 31, 2013 & Industrial CRE - Other ADC Subsidiaries
(Dollars in millions)
Commercial:
Pass $ 36,804 $ 10,883 $ 794 $ 4,464
Special mention 219 58 11 8
Substandard - performing 1,122 602 98 29
N
onperforming 363 129 35 1
Total $ 38,508 $ 11,672 $ 938 $ 4,502
Direct Retail Revolving Residential Sales Other Lending
Lending Credit Mortgage Finance Subsidiaries
(Dollars in millions)
Retail:
Performing $ 15,760 $ 2,403 $ 24,405 $ 9,377 $ 5,910
N
onperforming 109 ― 243 5 50
Total $ 15,869 $ 2,403 $ 24,648 $ 9,382 $ 5,960