BB&T 2013 Annual Report Download - page 51
Download and view the complete annual report
Please find page 51 of the 2013 BB&T annual report below. You can navigate through the pages in the report by either clicking on the pages listed below, or by using the keyword search tool below to find specific information within the annual report.-
 1
1 -
2
-
3
-
4
-
5
-
6
-
7
-
8
-
9
-
10
-
11
-
12
-
13
-
14
-
15
-
16
-
17
-
18
-
19
-
20
-
21
-
22
-
23
-
24
-
25
-
26
-
27
-
28
-
29
-
30
-
31
-
32
-
33
-
34
-
35
-
36
-
37
-
38
-
39
-
40
-
 41
41 -
 42
42 -
 43
43 -
 44
44 -
 45
45 -
 46
46 -
 47
47 -
 48
48 -
 49
49 -
 50
50 -
 51
51 -
 52
52 -
 53
53 -
 54
54 -
 55
55 -
 56
56 -
 57
57 -
 58
58 -
 59
59 -
 60
60 -
 61
61 -
62
-
63
-
64
-
65
-
66
-
67
-
68
-
69
-
70
-
71
-
72
-
73
-
74
-
75
-
76
-
77
-
78
-
79
-
80
-
81
-
82
-
83
-
84
-
85
-
86
-
87
-
88
-
89
-
90
-
91
-
92
-
93
-
94
-
95
-
96
-
97
-
98
-
99
-
100
-
101
-
102
-
103
-
104
-
105
-
106
-
107
-
108
-
109
-
110
-
111
-
112
-
113
-
114
-
115
-
116
-
117
-
118
-
119
-
120
-
121
-
122
-
123
-
124
-
125
-
126
-
127
-
128
-
129
-
130
-
131
-
132
-
133
-
134
-
135
-
136
-
137
-
138
-
139
-
140
-
141
-
142
-
143
-
144
-
145
-
146
-
147
-
148
-
149
-
150
-
151
-
152
-
153
-
154
-
155
-
156
-
157
-
158
 |
 |

51
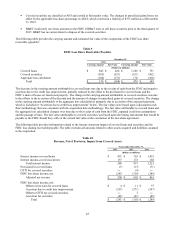
Noninterest income was $1.5 billion, an increase of $170 million, or 12.5%, compared to 2012. The increase reflects the
acquisition of Crump Insurance on April 2, 2012, firming market conditions for insurance premiums, organic growth in
wholesale and retail property and casualty insurance operations, wholesale life insurance growth, and an experience-based
refund of reinsurance premiums totaling $13 million that was received in the second quarter of 2013. Wholesale property and
casualty insurance income increased $59 million, or 15.5%, while retail property and casualty insurance income increased
$36 million, or 8.1%, compared to 2012. Wholesale life insurance income increased $43 million, or 34.5%, compared to
2012, primarily attributable to the Crump Insurance acquisition.
Higher noninterest income growth was offset by a $119 million increase in noninterest expense, primarily the result of higher
salary costs and performance-based incentives. The increase in noninterest expense was partially attributable to the Crump
Insurance acquisition in 2012.
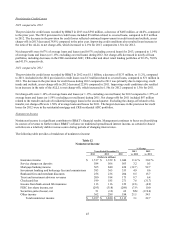
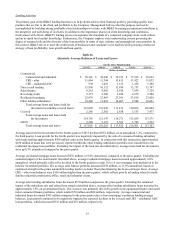
Financial Services
Financial Services net income was $305 million in 2013, an increase of $21 million, or 7.4%, compared to 2012.
Segment net interest income for Financial Services decreased $2 million, to $447 million in 2013. The decrease in segment
net interest income during 2013 was primarily attributable to a lower NIM, partially offset by strong organic loan growth and
an improved deposit mix. Corporate Banking’s average loan balances increased by $1.5 billion, or 24.9%, in 2013, while
BB&T Wealth’s average loan balances grew $250 million, or 21.6%, over the same time period.
The allocated provision for loan and lease losses increased $6 million to $19 million in 2013, primarily attributable to a $10
million reserve release in 2012 resulting from improved credit trends in the commercial and industrial loan portfolio.
Noninterest income for Financial Services increased $24 million, or 3.3%, to $743 million in 2013. The increase in
noninterest income was primarily due to higher investment banking and brokerage fees and commissions and trust and
investment advisory revenues. Client invested assets totaled $111.2 billion as of December 31, 2013, an increase of $15.0
billion, or 15.6%, compared to 2012.
Noninterest expense incurred by Financial Services decreased $26 million, or 4.0%, to $617 million in 2013, primarily due to
lower occupancy and equipment expense and an operating charge-off in the prior year, partially offset by an increase in
personnel expense.
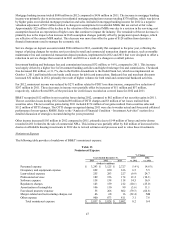
Other, Treasury & Corporate
Net income in Other, Treasury & Corporate can vary due to changing needs of the Company, including the size of the
investment portfolio, the need for wholesale funding, income received from derivatives used to hedge the balance sheet and,
in certain cases, income associated with acquisition activities.
Other, Treasury & Corporate generated a net loss of $487 million in 2013, compared to net income of $50 million in the prior
year. The net loss was primarily the result of $516 million in adjustments for uncertain income tax positions as previously
described. Segment net interest income decreased $139 million primarily attributable to runoff in the covered loan portfolio.
The $128 million increase in noninterest income primarily reflects the gain on the sale of a consumer lending subsidiary
totaling $31 million, higher income from assets related to certain post-employment benefits, higher securities gains in the
investment portfolio, and higher FDIC loss share income. The $88 million increase in noninterest expense was primarily
attributable to personnel expense related to certain post-employment benefits mentioned above, and higher professional
services, data processing software, and IT professional services expense related to corporate project initiatives.
2012 compared to 2011
Community Banking
Community Banking had a network of 1,832 banking offices at the end of 2012, an increase of 53 offices compared to
December 31, 2011. The increase in offices was driven by the BankAtlantic acquisition and de novo branch openings,
partially offset by the closing of low volume branches. Community Banking results include BankAtlantic since the systems
conversion in October 2012. Community Banking net income was $722 million in 2012, up $225 million, or 45.3%,
compared to 2011.