BB&T 2013 Annual Report Download - page 31
Download and view the complete annual report
Please find page 31 of the 2013 BB&T annual report below. You can navigate through the pages in the report by either clicking on the pages listed below, or by using the keyword search tool below to find specific information within the annual report.-
 1
1 -
2
-
3
-
4
-
5
-
6
-
7
-
8
-
9
-
10
-
11
-
12
-
13
-
14
-
15
-
16
-
17
-
18
-
19
-
20
-
 21
21 -
 22
22 -
 23
23 -
 24
24 -
 25
25 -
 26
26 -
 27
27 -
 28
28 -
 29
29 -
 30
30 -
 31
31 -
 32
32 -
 33
33 -
 34
34 -
 35
35 -
 36
36 -
 37
37 -
 38
38 -
 39
39 -
 40
40 -
 41
41 -
42
-
43
-
44
-
45
-
46
-
47
-
48
-
49
-
50
-
51
-
52
-
53
-
54
-
55
-
56
-
57
-
58
-
59
-
60
-
61
-
62
-
63
-
64
-
65
-
66
-
67
-
68
-
69
-
70
-
71
-
72
-
73
-
74
-
75
-
76
-
77
-
78
-
79
-
80
-
81
-
82
-
83
-
84
-
85
-
86
-
87
-
88
-
89
-
90
-
91
-
92
-
93
-
94
-
95
-
96
-
97
-
98
-
99
-
100
-
101
-
102
-
103
-
104
-
105
-
106
-
107
-
108
-
109
-
110
-
111
-
112
-
113
-
114
-
115
-
116
-
117
-
118
-
119
-
120
-
121
-
122
-
123
-
124
-
125
-
126
-
127
-
128
-
129
-
130
-
131
-
132
-
133
-
134
-
135
-
136
-
137
-
138
-
139
-
140
-
141
-
142
-
143
-
144
-
145
-
146
-
147
-
148
-
149
-
150
-
151
-
152
-
153
-
154
-
155
-
156
-
157
-
158
 |
 |

31
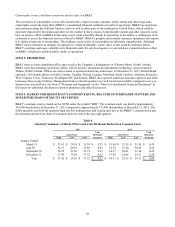
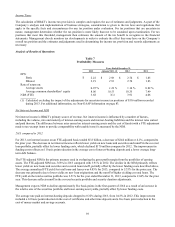
Equity Compensation Plan Information
The following table provides information concerning securities to be issued upon the exercise of outstanding equity-based
awards, the weighted average price of such awards and the securities remaining available for future issuance as of December
31, 2013.
Table 6
Equity Compensation Plan Information
(a)(1) (b)(2) (c)(3)
Number of securities Weighted-average Number of securities remaining
to be issued upon exercise price of available for future issuance
exercise of outstanding outstanding options, under equity compensation plans
Plan Category options, warrants and rights warrants and rights (excluding securities reflected in (a))
Approved by security holders 52,966,410 $ 34.90 30,561,739
N
ot approved by security holders ― ― ―
Total 52,966,410 34.90 30,561,739
(1) Includes 14,970,214 RSUs.
(2) Excludes RSUs because they do not have an exercise price.
(3) All awards remaining available for future issuance will be issued under the terms of the 2012 Incentive Plan.
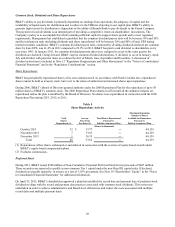
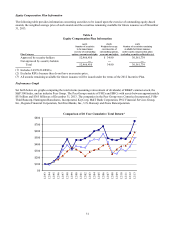
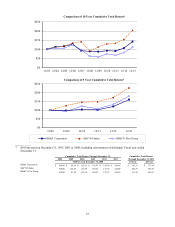
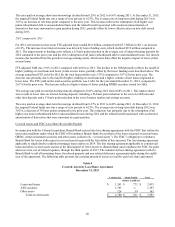
Performance Graph
Set forth below are graphs comparing the total returns (assuming reinvestment of dividends) of BB&T common stock, the
S&P 500 Index, and an industry Peer Group. The Peer Group consists of FHCs and BHCs with assets between approximately
$55 billion and $365 billion as of December 31, 2013. The companies in the Peer Group were Comerica Incorporated, Fifth-
Third Bancorp, Huntington Bancshares, Incorporated, KeyCorp, M&T Bank Corporation, PNC Financial Services Group,
Inc., Regions Financial Corporation, SunTrust Banks, Inc., U.S. Bancorp and Zions Bancorporation.
$0
$100
$200
$300
$400
$500
$600
$700
$800
12/93
12/94
12/95
12/96
12/97
12/98
12/99
12/00
12/01
12/02
12/03
12/04
12/05
12/06
12/07
12/08
12/09
12/10
12/11
12/12
12/13
Comparison of 20 Year Cumulative Total Return*