BB&T 2013 Annual Report Download - page 46
Download and view the complete annual report
Please find page 46 of the 2013 BB&T annual report below. You can navigate through the pages in the report by either clicking on the pages listed below, or by using the keyword search tool below to find specific information within the annual report.-
 1
1 -
2
-
3
-
4
-
5
-
6
-
7
-
8
-
9
-
10
-
11
-
12
-
13
-
14
-
15
-
16
-
17
-
18
-
19
-
20
-
21
-
22
-
23
-
24
-
25
-
26
-
27
-
28
-
29
-
30
-
31
-
32
-
33
-
34
-
35
-
 36
36 -
 37
37 -
 38
38 -
 39
39 -
 40
40 -
 41
41 -
 42
42 -
 43
43 -
 44
44 -
 45
45 -
 46
46 -
 47
47 -
 48
48 -
 49
49 -
 50
50 -
 51
51 -
 52
52 -
 53
53 -
 54
54 -
 55
55 -
 56
56 -
57
-
58
-
59
-
60
-
61
-
62
-
63
-
64
-
65
-
66
-
67
-
68
-
69
-
70
-
71
-
72
-
73
-
74
-
75
-
76
-
77
-
78
-
79
-
80
-
81
-
82
-
83
-
84
-
85
-
86
-
87
-
88
-
89
-
90
-
91
-
92
-
93
-
94
-
95
-
96
-
97
-
98
-
99
-
100
-
101
-
102
-
103
-
104
-
105
-
106
-
107
-
108
-
109
-
110
-
111
-
112
-
113
-
114
-
115
-
116
-
117
-
118
-
119
-
120
-
121
-
122
-
123
-
124
-
125
-
126
-
127
-
128
-
129
-
130
-
131
-
132
-
133
-
134
-
135
-
136
-
137
-
138
-
139
-
140
-
141
-
142
-
143
-
144
-
145
-
146
-
147
-
148
-
149
-
150
-
151
-
152
-
153
-
154
-
155
-
156
-
157
-
158
 |
 |
46
2013 compared to 2012
Noninterest income was $3.9 billion for 2013, up 3.1% compared to 2012. This increase was driven by record income
generated by BB&T’s insurance, investment banking and brokerage, bankcard fees and merchant discounts, and trust and
investment advisory LOBs, along with strong growth in checkcard fees and steady growth in service charges on deposits.
This growth in noninterest income was negatively impacted by a decrease in mortgage banking income.
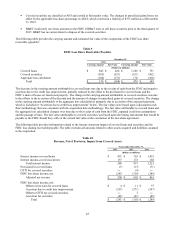
Income from BB&T’s insurance agency/brokerage operations was the largest source of noninterest income in 2013.
Insurance income was up 11.6% compared to 2012, with approximately one-half of the growth attributable to the acquisition
of Crump Insurance on April 2, 2012, and the remainder primarily the result of an improving market for insurance premiums
and a $13 million experience-based refund of reinsurance premiums that was received in the second quarter of 2013.
Investment banking and brokerage fees and commissions increased $18 million, or 4.9%, compared to 2012. This increase
was largely driven by higher investment commission income and increased investment banking activities. Bankcard fees and
merchant discounts increased $20 million, or 8.5%, in 2013, based on higher retail and commercial bankcard transaction
volumes and an increase in merchant discount income. Trust and investment advisory revenues increased $16 million,
primarily the result of higher investment advisory revenues during the current year. Checkcard fees were $14 million higher
than the prior year, an increase of 7.6%, reflecting increased transaction volume, a portion of which is attributable to the
acquisition of BankAtlantic in the prior year. Service charges totaled $584 million, an increase of $18 million, or 3.2%,
compared to 2012, reflecting growth in cash management products, an increase in other deposit fees and the impact of the
BankAtlantic acquisition.
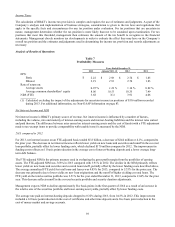
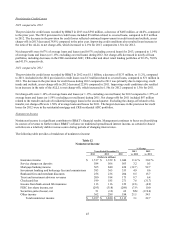
Mortgage banking income totaled $565 million in 2013, a decrease of $275 million, or 32.7%, compared to the prior year.
The decrease in mortgage banking income includes a $247 million decrease in residential mortgage production revenues and
a $61 million decrease in net MSR and related hedge valuation adjustments compared to the prior year. These decreases were
partially offset by a $12 million increase in residential mortgage servicing revenues, which primarily reflects growth in the
servicing portfolio, and a $28 million decrease in the amortization of MSRs that was primarily driven by slower prepayment
speeds. The decrease in residential mortgage production revenues primarily resulted from lower gain on sale margins, which
reflects increased competition and a higher proportion of loans originated through the correspondent network. The weighted
average gain on sale margin for 2013 was 1.15%, a 49.2% decline compared to the prior year. Correspondent loan
originations represented 65.1% of mortgage loan originations in 2013, compared to 60.5% of mortgage loan originations in
2012.
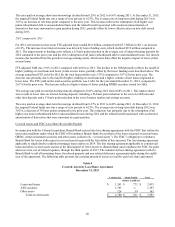
FDIC loss share income, net reflects accretion of the FDIC loss share receivable due to credit loss improvement (including
expense associated with the aggregate loss calculation) and accretion related to covered securities, partially reduced by the
offset to the provision for covered loans. Covered loans have experienced better performance than originally anticipated,
which has resulted in the recognition of additional interest income on a level yield basis over the expected life of the
corresponding loans. A significant portion of this increase in interest income is offset by a reduction in noninterest income
recorded in FDIC loss share income. For 2013, noninterest income was reduced by $255 million related to improvement in
loan performance compared to a reduction of $271 million in 2012. These decreases in income were partially offset by
increases of $4 million and $11 million, respectively, which reflected 80% of the provision for credit losses recorded on
covered loans for 2013 and 2012.
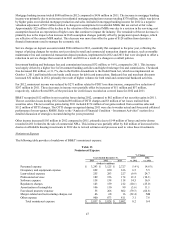
BB&T recognized $51 million in net securities gains during 2013, compared to $12 million of net securities losses in 2012.
Other income increased $63 million in 2013 compared to 2012, primarily due to a $31 million gain on the sale of a consumer
lending subsidiary in 2013, a $22 million increase in income from operating leases and a $21 million increase in income from
assets related to certain post-employment benefits, which is offset in personnel expense. These increases were partially offset
by a $10 million decrease in client derivative related activities.
2012 compared to 2011
Noninterest income was $3.8 billion for 2012, up 22.7% compared to 2011. This increase was driven by growth in BB&T’s
insurance, mortgage banking and investment banking and brokerage LOBs. In addition, bankcard fees and merchant
discounts and other income increased compared to the prior year. These increases were partially offset by lower checkcard
fees, a decrease in income related to the FDIC loss share receivable and a reduction in net securities income.
Insurance income was up 30.2% compared to 2011, primarily due to the acquisition of Crump Insurance on April 2, 2012,
which added approximately $234 million in revenues during 2012. The remainder of the increase in insurance income is
attributable to the impact of other acquisitions that closed during the fourth quarter of 2011 and firming market conditions.