BB&T 2013 Annual Report Download - page 67
Download and view the complete annual report
Please find page 67 of the 2013 BB&T annual report below. You can navigate through the pages in the report by either clicking on the pages listed below, or by using the keyword search tool below to find specific information within the annual report.-
 1
1 -
2
-
3
-
4
-
5
-
6
-
7
-
8
-
9
-
10
-
11
-
12
-
13
-
14
-
15
-
16
-
17
-
18
-
19
-
20
-
21
-
22
-
23
-
24
-
25
-
26
-
27
-
28
-
29
-
30
-
31
-
32
-
33
-
34
-
35
-
36
-
37
-
38
-
39
-
40
-
41
-
42
-
43
-
44
-
45
-
46
-
47
-
48
-
49
-
50
-
51
-
52
-
53
-
54
-
55
-
56
-
 57
57 -
 58
58 -
 59
59 -
 60
60 -
 61
61 -
 62
62 -
 63
63 -
 64
64 -
 65
65 -
 66
66 -
 67
67 -
 68
68 -
 69
69 -
 70
70 -
 71
71 -
 72
72 -
 73
73 -
 74
74 -
 75
75 -
 76
76 -
 77
77 -
78
-
79
-
80
-
81
-
82
-
83
-
84
-
85
-
86
-
87
-
88
-
89
-
90
-
91
-
92
-
93
-
94
-
95
-
96
-
97
-
98
-
99
-
100
-
101
-
102
-
103
-
104
-
105
-
106
-
107
-
108
-
109
-
110
-
111
-
112
-
113
-
114
-
115
-
116
-
117
-
118
-
119
-
120
-
121
-
122
-
123
-
124
-
125
-
126
-
127
-
128
-
129
-
130
-
131
-
132
-
133
-
134
-
135
-
136
-
137
-
138
-
139
-
140
-
141
-
142
-
143
-
144
-
145
-
146
-
147
-
148
-
149
-
150
-
151
-
152
-
153
-
154
-
155
-
156
-
157
-
158
 |
 |

67
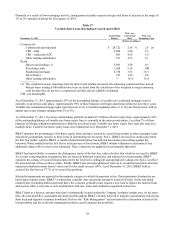
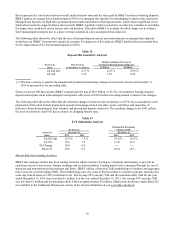
BB&T’s net charge-offs totaled $792 million for 2013, compared to $1.3 billion in 2012. Included in net charge-offs for 2013
and 2012 was $19 million and $34 million, respectively, of charge-offs related to covered loans. BB&T’s net charge-offs as a
percentage of average loans and leases was 0.67% (and 0.67% excluding covered loans) for 2013, compared to 1.14% (or
1.15% excluding covered loans), in 2012. Net charge-offs decreased in most lending portfolios, including a 37.2% decrease
in commercial and industrial, a 70.8% decrease in CRE – other and a 41.5% reduction in direct retail lending net charge-offs.
Net charge-offs for the other lending subsidiaries portfolio increased 11.1%, primarily reflecting growth in the loan portfolio.
Management expects that net charge-offs will remain slightly below the normalized range for net charge-offs (which ranges
from 50 to 70 basis points).
Refer to Note 3 “Loans and ACL” in the “Notes to Consolidated Financial Statements” for additional disclosures.
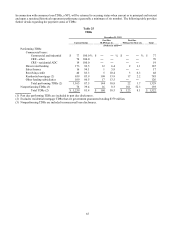
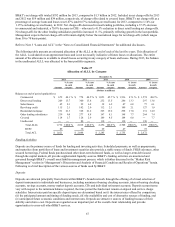
The following table presents an estimated allocation of the ALLL at the end of each of the last five years. This allocation of
the ALLL is calculated on an approximate basis and is not necessarily indicative of future losses or allocations. The entire
amount of the allowance is available to absorb losses occurring in any category of loans and leases. During 2013, the balance
in the unallocated ALLL was allocated to the loan portfolio segments.
Table 27
Allocation of ALLL by Category
December 31,
2013 2012 2011 2010 2009
% Loans % Loans % Loans % Loans % Loans
in each in each in each in each in each
Amount category Amount category Amount category Amount category Amount category
(Dollars in millions)
Balances at end of period applicable to:
Commercial $ 679 44.1 % $ 774 44.5 % $ 1,053 45.7 % $ 1,536 47.1 % $ 1,574 48.2 %
Direct retail lending 209 13.7 300 13.8 232 13.5 246 13.3 297 13.8
Sales finance 45 8.1 29 6.8 38 6.9 47 6.8 77 6.1
Revolving credit 115 2.1 102 2.0 112 2.1 109 2.1 127 1.9
Residential mortgage 331 21.3 328 21.2 365 19.2 298 17.0 131 14.9
Other lending subsidiaries 239 9.0 277 8.8 197 8.1 198 7.7 264 7.4
Covered 114 1.7 128 2.9 149 4.5 144 6.0 ― 7.7
Unallocated ― ― 80 ― 110 ― 130 ― 130 ―
Total ALLL 1,732 100.0 % 2,018 100.0 % 2,256 100.0 % 2,708 100.0 % 2,600 100.0 %
RUFC 89 30 29 47 72
Total ACL $ 1,821 $ 2,048 $ 2,285 $ 2,755 $ 2,672
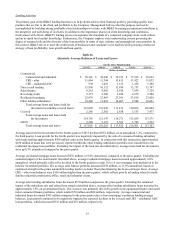
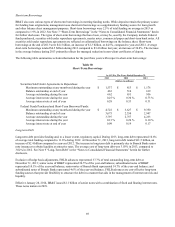
Funding Activities
Deposits are the primary source of funds for lending and investing activities. Scheduled payments, as well as prepayments,
and maturities from portfolios of loans and investment securities also provide a stable source of funds. FHLB advances, other
secured borrowings, Federal funds purchased and other short-term borrowed funds, as well as longer-term debt issued
through the capital markets, all provide supplemental liquidity sources. BB&T’s funding activities are monitored and
governed through BB&T’s overall asset/liability management process, which is further discussed in the “Market Risk
Management” section in “Management’s Discussion and Analysis of Financial Condition and Results of Operations” herein.
Following is a brief description of the various sources of funds used by BB&T.
Deposits
Deposits are attracted principally from clients within BB&T’s branch network through the offering of a broad selection of
deposit instruments to individuals and businesses, including noninterest-bearing checking accounts, interest-bearing checking
accounts, savings accounts, money market deposit accounts, CDs and individual retirement accounts. Deposit account terms
vary with respect to the minimum balance required, the time period the funds must remain on deposit and service charge
schedules. Interest rates paid on specific deposit types are determined based on (i) the interest rates offered by competitors,
(ii) the anticipated amount and timing of funding needs, (iii) the availability and cost of alternative sources of funding, and
(iv) anticipated future economic conditions and interest rates. Deposits are attractive sources of funding because of their
stability and relative cost. Deposits are regarded as an important part of the overall client relationship and provide
opportunities to cross-sell other BB&T services.