BB&T 2013 Annual Report Download - page 129
Download and view the complete annual report
Please find page 129 of the 2013 BB&T annual report below. You can navigate through the pages in the report by either clicking on the pages listed below, or by using the keyword search tool below to find specific information within the annual report.-
 1
1 -
2
-
3
-
4
-
5
-
6
-
7
-
8
-
9
-
10
-
11
-
12
-
13
-
14
-
15
-
16
-
17
-
18
-
19
-
20
-
21
-
22
-
23
-
24
-
25
-
26
-
27
-
28
-
29
-
30
-
31
-
32
-
33
-
34
-
35
-
36
-
37
-
38
-
39
-
40
-
41
-
42
-
43
-
44
-
45
-
46
-
47
-
48
-
49
-
50
-
51
-
52
-
53
-
54
-
55
-
56
-
57
-
58
-
59
-
60
-
61
-
62
-
63
-
64
-
65
-
66
-
67
-
68
-
69
-
70
-
71
-
72
-
73
-
74
-
75
-
76
-
77
-
78
-
79
-
80
-
81
-
82
-
83
-
84
-
85
-
86
-
87
-
88
-
89
-
90
-
91
-
92
-
93
-
94
-
95
-
96
-
97
-
98
-
99
-
100
-
101
-
102
-
103
-
104
-
105
-
106
-
107
-
108
-
109
-
110
-
111
-
112
-
113
-
114
-
115
-
116
-
117
-
118
-
 119
119 -
 120
120 -
 121
121 -
 122
122 -
 123
123 -
 124
124 -
 125
125 -
 126
126 -
 127
127 -
 128
128 -
 129
129 -
 130
130 -
 131
131 -
 132
132 -
 133
133 -
 134
134 -
 135
135 -
 136
136 -
 137
137 -
 138
138 -
 139
139 -
140
-
141
-
142
-
143
-
144
-
145
-
146
-
147
-
148
-
149
-
150
-
151
-
152
-
153
-
154
-
155
-
156
-
157
-
158
 |
 |

129
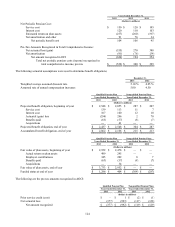
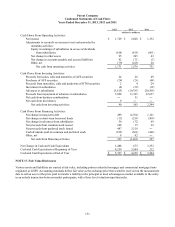
NOTE 16. Parent Company Financial Statements
Parent Company
Condensed Balance Sheets
December 31, 2013 and 2012
December 31,
2013 2012
(Dollars in millions)
Assets:
Cash and due from banks $ ― $ 4,239
Interest-bearing deposits with banks 5,727 ―
AFS securities at fair value 26 27
HTM securities at amortized cost 35 37
Investment in banking subsidiaries 22,314 21,189
Investment in other subsidiaries 1,281 1,837
Advances to / receivables from banking subsidiaries 106 44
Advances to / receivables from other subsidiaries 2,308 2,408
Other assets 194 246
Total assets $ 31,991 $ 30,027
Liabilities and Shareholders' Equity:
Short-term borrowed funds $ 24 $ 37
Short-term borrowed funds due to subsidiaries 50 ―
Dividends payable ― 170
Accounts payable and other liabilities 76 30
Long-term debt 9,032 8,567
Total liabilities 9,182 8,804
Total shareholders' equity 22,809 21,223
Total liabilities and shareholders' equity $ 31,991 $ 30,027