BB&T 2013 Annual Report Download - page 63
Download and view the complete annual report
Please find page 63 of the 2013 BB&T annual report below. You can navigate through the pages in the report by either clicking on the pages listed below, or by using the keyword search tool below to find specific information within the annual report.-
 1
1 -
2
-
3
-
4
-
5
-
6
-
7
-
8
-
9
-
10
-
11
-
12
-
13
-
14
-
15
-
16
-
17
-
18
-
19
-
20
-
21
-
22
-
23
-
24
-
25
-
26
-
27
-
28
-
29
-
30
-
31
-
32
-
33
-
34
-
35
-
36
-
37
-
38
-
39
-
40
-
41
-
42
-
43
-
44
-
45
-
46
-
47
-
48
-
49
-
50
-
51
-
52
-
 53
53 -
 54
54 -
 55
55 -
 56
56 -
 57
57 -
 58
58 -
 59
59 -
 60
60 -
 61
61 -
 62
62 -
 63
63 -
 64
64 -
 65
65 -
 66
66 -
 67
67 -
 68
68 -
 69
69 -
 70
70 -
 71
71 -
 72
72 -
 73
73 -
74
-
75
-
76
-
77
-
78
-
79
-
80
-
81
-
82
-
83
-
84
-
85
-
86
-
87
-
88
-
89
-
90
-
91
-
92
-
93
-
94
-
95
-
96
-
97
-
98
-
99
-
100
-
101
-
102
-
103
-
104
-
105
-
106
-
107
-
108
-
109
-
110
-
111
-
112
-
113
-
114
-
115
-
116
-
117
-
118
-
119
-
120
-
121
-
122
-
123
-
124
-
125
-
126
-
127
-
128
-
129
-
130
-
131
-
132
-
133
-
134
-
135
-
136
-
137
-
138
-
139
-
140
-
141
-
142
-
143
-
144
-
145
-
146
-
147
-
148
-
149
-
150
-
151
-
152
-
153
-
154
-
155
-
156
-
157
-
158
 |
 |

63
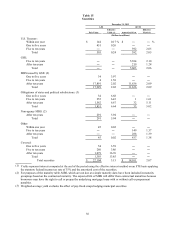
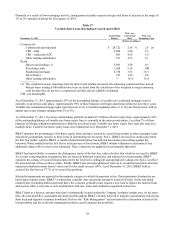
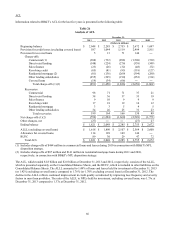
Loans 90 days or more past due and still accruing interest excluding government guaranteed loans and covered loans, totaled
$122 million at December 31, 2013, compared with $167 million at year-end 2012, a decline of 26.9%. Loans 30-89 days
past due, excluding government guaranteed loans and covered loans, totaled $940 million at December 31, 2013, which was a
decline of $128 million, or 12.0%, compared to year-end 2012. Excluding government guaranteed loans and covered loans,
BB&T’s past due asset quality metrics are essentially at normalized levels.
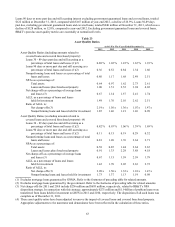
Table 23
Asset Quality Ratios
As Of / For The Years Ended December 31,
2013 2012 2011 2010 2009
Asset Quality Ratios (including amounts related to
covered loans and covered foreclosed property):
Loans 30 - 89 days past due and still accruing as a
percentage of total loans and leases (1)(2) 0.88 % 1.02 % 1.22 % 1.65 % 1.93 %
Loans 90 days or more past due and still accruing as a
percentage of total loans and leases (1)(2) 0.36 0.52 0.84 1.34 1.60
N
onperforming loans and leases as a percentage of total
loans and leases 0.80 1.17 1.68 2.49 2.51
N
PAs as a percentage of:
Total assets 0.64 0.97 1.62 2.73 2.61
Loans and leases plus foreclosed property 1.00 1.51 2.52 3.94 4.02
N
et charge-offs as a percentage of average loans
and leases (3) 0.67 1.14 1.57 2.41 1.74
ALLL as a percentage of loans and leases
held for investment 1.49 1.76 2.10 2.62 2.51
Ratio of ALLL to:
N
et charge-offs (3) 2.19 x 1.56 x 1.36 x 1.07 x 1.47 x
N
onperforming loans and leases held for investmen
t
1.85 1.46 1.21 1.26 0.98
Asset Quality Ratios (excluding amounts related to
covered loans and covered foreclosed property): (4)
Loans 30 - 89 days past due and still accruing as a
percentage of total loans and leases (1)(2) 0.82 % 0.93 % 1.06 % 1.39 % 1.69 %
Loans 90 days or more past due and still accruing as a
percentage of total loans and leases (1)(2) 0.11 0.15 0.19 0.29 0.32
N
onperforming loans and leases as a percentage of total
loans and leases 0.81 1.20 1.76 2.64 2.71
N
PAs as a percentage of:
Total assets 0.58 0.85 1.44 2.64 2.65
Loans and leases plus foreclosed property 0.91 1.33 2.29 3.88 4.18
N
et charge-offs as a percentage of average loans
and leases (3) 0.67 1.15 1.59 2.59 1.79
ALLL as a percentage of loans and leases
held for investment 1.42 1.70 2.05 2.63 2.72
Ratio of ALLL to:
N
et charge-offs (3) 2.09 x 1.50 x 1.32 x 1.01 x 1.47 x
N
onperforming loans and leases held for investmen
t
1.73 1.37 1.13 1.19 0.98
(1) Excludes mortgage loans guaranteed by GNMA. Refer to the footnotes of preceding table for related amounts.
(2) Excludes mortgage loans guaranteed by the government. Refer to the footnotes of preceding table for related amounts.
(3) Net charge-offs for 2011 and 2010 include $236 million and $695 million, respectively, related to BB&T’s NPA
disposition strategy. In connection with this strategy, approximately $271 million and $1.9 billion of problem loans were
transferred from loans held for investment to LHFS in 2011 and 2010, respectively. The disposition of all such loans was
complete as of December 31, 2011.
(4) These asset quality ratios have been adjusted to remove the impact of covered loans and covered foreclosed property.
Appropriate adjustments to the numerator and denominator have been reflected in the calculation of these ratios.