BB&T 2013 Annual Report Download - page 135
Download and view the complete annual report
Please find page 135 of the 2013 BB&T annual report below. You can navigate through the pages in the report by either clicking on the pages listed below, or by using the keyword search tool below to find specific information within the annual report.-
 1
1 -
2
-
3
-
4
-
5
-
6
-
7
-
8
-
9
-
10
-
11
-
12
-
13
-
14
-
15
-
16
-
17
-
18
-
19
-
20
-
21
-
22
-
23
-
24
-
25
-
26
-
27
-
28
-
29
-
30
-
31
-
32
-
33
-
34
-
35
-
36
-
37
-
38
-
39
-
40
-
41
-
42
-
43
-
44
-
45
-
46
-
47
-
48
-
49
-
50
-
51
-
52
-
53
-
54
-
55
-
56
-
57
-
58
-
59
-
60
-
61
-
62
-
63
-
64
-
65
-
66
-
67
-
68
-
69
-
70
-
71
-
72
-
73
-
74
-
75
-
76
-
77
-
78
-
79
-
80
-
81
-
82
-
83
-
84
-
85
-
86
-
87
-
88
-
89
-
90
-
91
-
92
-
93
-
94
-
95
-
96
-
97
-
98
-
99
-
100
-
101
-
102
-
103
-
104
-
105
-
106
-
107
-
108
-
109
-
110
-
111
-
112
-
113
-
114
-
115
-
116
-
117
-
118
-
119
-
120
-
121
-
122
-
123
-
124
-
 125
125 -
 126
126 -
 127
127 -
 128
128 -
 129
129 -
 130
130 -
 131
131 -
 132
132 -
 133
133 -
 134
134 -
 135
135 -
 136
136 -
 137
137 -
 138
138 -
 139
139 -
 140
140 -
 141
141 -
 142
142 -
 143
143 -
 144
144 -
 145
145 -
146
-
147
-
148
-
149
-
150
-
151
-
152
-
153
-
154
-
155
-
156
-
157
-
158
 |
 |

135
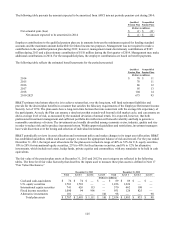
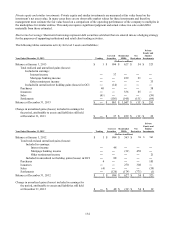
Private
States & Equity and
Political Other Covered Residential Net Similar
Year Ended December 31, 2011 Trading Subdivisions Securities Securities MSRs Derivatives Investments
(Dollars in millions)
Balance at January 1, 2011 $ 11 $ 119 $ 7 $ 954 $ 830 $ (25) $ 266
Total realized and unrealized gains (losses):
Included in earnings:
Interest income ― ― ― 54 ― ― ―
Mortgage banking income ― ― ― ― (341) 151 ―
Other noninterest income (3) ― ― ― ― ― 64
Included in OCI ― (9) (1) 24 ― ― ―
Purchases 7 ― ― ― ― ― 61
Issuances ― ― ― ― 225 110 ―
Sales (14) ― ― ― ― ― (112)
Settlements ― (53) (1) (48) (151) (177) (15)
Transfers into Level 3 ― ― ― ― ― ― 1
Transfers out of Level 3 ― (57) (5) ― ― ― (4)
Balance at December 31, 2011 $ 1 $ ― $ ― $ 984 $ 563 $ 59 $ 261
Change in unrealized gains (losses)
included in earnings for the period,
attributable to assets and liabilities
still held at December 31, 2011 $ ― $ ― $ ― $ 54 $ (341) $ 59 $ 39
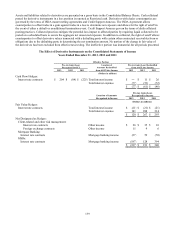
BB&T’s policy is to recognize transfers in and transfers out of Levels 1, 2 and 3 as of the end of a reporting period. During
the years ended December 31, 2013 and 2012, BB&T did not have any material transfer of securities between levels in the
fair value hierarchy. During the year ended December 31, 2011, BB&T transferred certain state and political subdivision
securities out of Level 3 as a result of management’s decision to reclassify them from AFS to HTM classification, which is
not recorded at fair value. There were no gains or losses recognized as a result of this transfer.
BB&T’s private equity and similar investments are primarily in SBIC qualified funds, which focus on equity and
subordinated debt investments in privately-held middle market companies. These investments generally are not redeemable
and distributions are received as the underlying assets of the funds liquidate. The timing of distributions, which are expected
to occur on various dates through 2025, is uncertain and dependent on various events such as recapitalizations, refinance
transactions and ownership changes among others. Excluding the investment of future funds, BB&T estimates these
investments have a weighted average remaining life of approximately three years; however, the timing and amount of
distributions may vary significantly. As of December 31, 2013, restrictions on the ability to sell the investments include, but
are not limited to, consent of a majority member or general partner approval for transfer of ownership. BB&T’s investments
are spread over numerous privately-held middle market companies, and thus the sensitivity to a change in fair value for any
single investment is limited. The significant unobservable inputs for these investments are EBITDA multiples that ranged
from 2x to 10x, with a weighted average of 7x, at December 31, 2013.
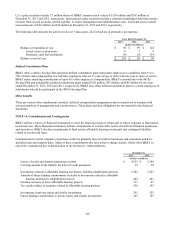
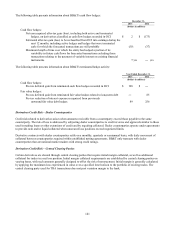
The following table details the fair value and UPB of LHFS that were elected to be carried at fair value:
December 31, 2013 December 31, 2012
Fair Aggregate Fair Aggregate
Value UPB Difference Value UPB Difference
(Dollars in millions)
LHFS reported at fair value $ 1,222 $ 1,223 $ (1) $ 3,761 $ 3,652 $ 109
Excluding government guaranteed, there were no LHFS that were nonaccrual or 90 days or more past due and still accruing
interest.