BB&T 2013 Annual Report Download - page 147
Download and view the complete annual report
Please find page 147 of the 2013 BB&T annual report below. You can navigate through the pages in the report by either clicking on the pages listed below, or by using the keyword search tool below to find specific information within the annual report.-
 1
1 -
2
-
3
-
4
-
5
-
6
-
7
-
8
-
9
-
10
-
11
-
12
-
13
-
14
-
15
-
16
-
17
-
18
-
19
-
20
-
21
-
22
-
23
-
24
-
25
-
26
-
27
-
28
-
29
-
30
-
31
-
32
-
33
-
34
-
35
-
36
-
37
-
38
-
39
-
40
-
41
-
42
-
43
-
44
-
45
-
46
-
47
-
48
-
49
-
50
-
51
-
52
-
53
-
54
-
55
-
56
-
57
-
58
-
59
-
60
-
61
-
62
-
63
-
64
-
65
-
66
-
67
-
68
-
69
-
70
-
71
-
72
-
73
-
74
-
75
-
76
-
77
-
78
-
79
-
80
-
81
-
82
-
83
-
84
-
85
-
86
-
87
-
88
-
89
-
90
-
91
-
92
-
93
-
94
-
95
-
96
-
97
-
98
-
99
-
100
-
101
-
102
-
103
-
104
-
105
-
106
-
107
-
108
-
109
-
110
-
111
-
112
-
113
-
114
-
115
-
116
-
117
-
118
-
119
-
120
-
121
-
122
-
123
-
124
-
125
-
126
-
127
-
128
-
129
-
130
-
131
-
132
-
133
-
134
-
135
-
136
-
 137
137 -
 138
138 -
 139
139 -
 140
140 -
 141
141 -
 142
142 -
 143
143 -
 144
144 -
 145
145 -
 146
146 -
 147
147 -
 148
148 -
 149
149 -
 150
150 -
 151
151 -
 152
152 -
 153
153 -
 154
154 -
 155
155 -
 156
156 -
 157
157 -
158
 |
 |

147
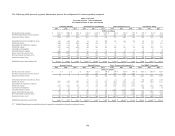
The following table presents segment information after the realignment of certain operating segments.
BB&T Corporation
Reportable Segments - After Realignment
Years Ended December 31, 2013, 2012 and 2011
Community Banking Residential Mortgage Banking Dealer Financial Services Specialized Lending
2013 2012 2011 2013 2012 2011 2013 2012 2011 2013 2012 2011
(Dollars in millions)
N
et interest income (expense) $ 1,712 $ 1,669 $ 1,555 $ 1,585 $ 1,564 $ 1,406 $ 834 $ 844 $ 852 $ 678 $ 701 $ 636
N
et intersegment interest income (expense) 1,341 1,565 1,844 (1,003) (1,044) (999) (159) (196) (270) (126) (139) (171)
Segment net interest income 3,053 3,234 3,399 582 520 407 675 648 582 552 562 465
Allocated provision for loan and lease losses 276 586 529 4 174 380 214 164 125 85 135 72
N
oninterest income 1,202 1,135 1,031 484 755 351 4 7 7 231 229 211
Intersegment net referral fees (expense) 173 190 131 (1) ― ― ― ― ― ― ― ―
N
oninterest expense 1,683 1,800 2,334 361 416 320 108 101 90 255 259 233
Amortization of intangibles 36 37 47 ― ― ― ― 1 1 5 5 6
Allocated corporate expenses 1,035 1,022 897 73 59 52 29 36 37 66 79 72
Income (loss) before income taxes 1,398 1,114 754 627 626 6 328 353 336 372 313 293
Provision (benefit) for income taxes 513 406 270 237 238 2 125 135 127 97 69 58
Segment net income (loss) $ 885 708 484 390 388 4 203 218 209 275 244 235
Identifiable segment assets (period end) $ 54,602 $ 54,731 52,368 36,207 37,593 32,413 11,526 10,264 9,874 17,629 18,907 16,773
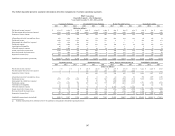
Insurance Services Financial Services Other, Treasury and Corporate (1) Total BB&T Corporation
2013 2012 2011 2013 2012 2011 2013 2012 2011 2013 2012 2011
(Dollars in millions)
N
et interest income (expense) $ 3 $ 3 $ 2 $ 129 $ 106 $ 98 $ 675 $ 970 $ 958 $ 5,616 $ 5,857 $ 5,507
N
et intersegment interest income (expense) 6 4 5 310 337 257 (369) (527) (666) ― ― ―
Segment net interest income 9 7 7 439 443 355 306 443 292 5,616 5,857 5,507
Allocated provision for loan and lease losses ― ― ― 17 11 (2) (4) (13) 86 592 1,057 1,190
N
oninterest income 1,535 1,365 1,041 743 719 683 (262) (390) (211) 3,937 3,820 3,113
Intersegment net referral fees (expense) ― ― ― 36 39 30 (208) (229) (161) ― ― ―
N
oninterest expense 1,135 1,016 786 617 643 575 1,572 1,483 1,365 5,731 5,718 5,703
Amortization of intangibles 61 61 42 3 3 3 1 3 ― 106 110 99
Allocated corporate expenses 96 82 72 99 93 74 (1,398) (1,371) (1,204) ― ― ―
Income (loss) before income taxes 252 213 148 482 451 418 (335) (278) (327) 3,124 2,792 1,628
Provision (benefit) for income taxes 85 70 46 181 169 155 157 (323) (362) 1,395 764 296
Segment net income (loss) $ 167 $ 143 102 301 282 263 (492) 45 35 $ 1,729 $ 2,028 $ 1,332
Identifiable segment assets (period end) $ 2,990 $ 3,297 2,350 9,876 8,845 7,243 50,180 50,862 53,990 $ 183,010 $ 184,499 $ 175,011
(1) Includes financial data from subsidiaries below the quantitative and qualitative thresholds requiring disclosure.