BB&T 2013 Annual Report Download - page 146
Download and view the complete annual report
Please find page 146 of the 2013 BB&T annual report below. You can navigate through the pages in the report by either clicking on the pages listed below, or by using the keyword search tool below to find specific information within the annual report.-
 1
1 -
2
-
3
-
4
-
5
-
6
-
7
-
8
-
9
-
10
-
11
-
12
-
13
-
14
-
15
-
16
-
17
-
18
-
19
-
20
-
21
-
22
-
23
-
24
-
25
-
26
-
27
-
28
-
29
-
30
-
31
-
32
-
33
-
34
-
35
-
36
-
37
-
38
-
39
-
40
-
41
-
42
-
43
-
44
-
45
-
46
-
47
-
48
-
49
-
50
-
51
-
52
-
53
-
54
-
55
-
56
-
57
-
58
-
59
-
60
-
61
-
62
-
63
-
64
-
65
-
66
-
67
-
68
-
69
-
70
-
71
-
72
-
73
-
74
-
75
-
76
-
77
-
78
-
79
-
80
-
81
-
82
-
83
-
84
-
85
-
86
-
87
-
88
-
89
-
90
-
91
-
92
-
93
-
94
-
95
-
96
-
97
-
98
-
99
-
100
-
101
-
102
-
103
-
104
-
105
-
106
-
107
-
108
-
109
-
110
-
111
-
112
-
113
-
114
-
115
-
116
-
117
-
118
-
119
-
120
-
121
-
122
-
123
-
124
-
125
-
126
-
127
-
128
-
129
-
130
-
131
-
132
-
133
-
134
-
135
-
 136
136 -
 137
137 -
 138
138 -
 139
139 -
 140
140 -
 141
141 -
 142
142 -
 143
143 -
 144
144 -
 145
145 -
 146
146 -
 147
147 -
 148
148 -
 149
149 -
 150
150 -
 151
151 -
 152
152 -
 153
153 -
 154
154 -
 155
155 -
 156
156 -
157
-
158
 |
 |

146
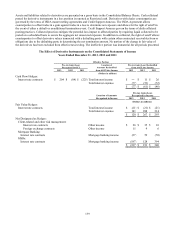
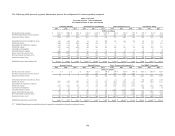
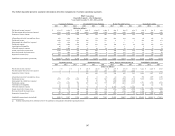
The following table presents segment information prior to the realignment of certain operating segments.
BB&T Corporation
Reportable Segments - Before Realignment
Years Ended December 31, 2013, 2012 and 2011
Community Banking Residential Mortgage Banking Dealer Financial Services Specialized Lending
2013 2012 2011 2013 2012 2011 2013 2012 2011 2013 2012 2011
(Dollars in millions)
N
et interest income (expense) $ 2,129 $ 2,084 $ 1,937 $ 1,168 $ 1,149 $ 1,024 $ 834 $ 844 $ 852 $ 678 $ 701 $ 636
N
et intersegment interest income (expense) 1,085 1,293 1,579 (747) (772) (734) (159) (196) (270) (126) (139) (171)
Segment net interest income 3,214 3,377 3,516 421 377 290 675 648 582 552 562 465
Allocated provision for loan and lease losses 246 665 589 34 95 320 214 164 125 85 135 72
N
oninterest income 1,202 1,136 1,031 484 754 351 4 7 7 231 229 211
Intersegment net referral fees (expense) 160 178 121 (1) ― ― ― ― ― ― ― ―
N
oninterest expense 1,701 1,827 2,356 344 389 297 108 101 90 255 259 233
Amortization of intangibles 36 37 47 ― ― ― ― 1 1 5 5 6
Allocated corporate expenses 1,040 1,026 901 68 55 48 29 36 37 66 79 72
Income (loss) before income taxes 1,553 1,136 775 458 592 (24) 328 353 336 372 313 293
Provision (benefit) for income taxes 571 414 278 174 225 (9) 125 135 127 97 69 58
Segment net income (loss) $ 982 $ 722 $ 497 $ 284 $ 367 $ (15) $ 203 $ 218 $ 209 $ 275 $ 244 $ 235
Identifiable segment assets (period end) $ 63,145 $ 62,821 $ 59,167 $ 27,664 $ 29,503 $ 25,614 $ 11,526 $ 10,264 $ 9,874 $ 17,629 $ 18,907 $ 16,773
Insurance Services Financial Services Other, Treasury and Corporate (1) Total BB&T Corporation
2013 2012 2011 2013 2012 2011 2013 2012 2011 2013 2012 2011
(Dollars in millions)
N
et interest income (expense) $ 3 $ 3 $ 2 $ 150 $ 123 $ 108 $ 654 $ 953 $ 948 $ 5,616 $ 5,857 $ 5,507
N
et intersegment interest income (expense) 6 4 5 297 326 250 (356) (516) (659) ― ― ―
Segment net interest income 9 7 7 447 449 358 298 437 289 5,616 5,857 5,507
Allocated provision for loan and lease losses ― ― ― 19 13 (1) (6) (15) 85 592 1,057 1,190
N
oninterest income 1,535 1,365 1,041 743 719 683 (262) (390) (211) 3,937 3,820 3,113
Intersegment net referral fees (expense) ― ― ― 36 39 30 (195) (217) (151) ― ― ―
N
oninterest expense 1,135 1,016 786 617 643 575 1,571 1,483 1,366 5,731 5,718 5,703
Amortization of intangibles 61 61 42 3 3 3 1 3 ― 106 110 99
Allocated corporate expenses 96 82 72 99 93 74 (1,398) (1,371) (1,204) ― ― ―
Income (loss) before income taxes 252 213 148 488 455 420 (327) (270) (320) 3,124 2,792 1,628
Provision (benefit) for income taxes 85 70 46 183 171 156 160 (320) (360) 1,395 764 296
Segment net income (loss) $ 167 $ 143 $ 102 $ 305 $ 284 $ 264 $ (487) $ 50 $ 40 $ 1,729 $ 2,028 $ 1,332
Identifiable segment assets (period end) $ 2,990 $ 3,297 $ 2,350 $ 10,434 $ 9,283 $ 7,497 $ 49,622 $ 50,424 $ 53,736 $ 183,010 $ 184,499 $ 175,011
(1) Includes financial data from subsidiaries below the quantitative and qualitative thresholds requiring disclosure.