BB&T 2013 Annual Report Download - page 111
Download and view the complete annual report
Please find page 111 of the 2013 BB&T annual report below. You can navigate through the pages in the report by either clicking on the pages listed below, or by using the keyword search tool below to find specific information within the annual report.-
 1
1 -
2
-
3
-
4
-
5
-
6
-
7
-
8
-
9
-
10
-
11
-
12
-
13
-
14
-
15
-
16
-
17
-
18
-
19
-
20
-
21
-
22
-
23
-
24
-
25
-
26
-
27
-
28
-
29
-
30
-
31
-
32
-
33
-
34
-
35
-
36
-
37
-
38
-
39
-
40
-
41
-
42
-
43
-
44
-
45
-
46
-
47
-
48
-
49
-
50
-
51
-
52
-
53
-
54
-
55
-
56
-
57
-
58
-
59
-
60
-
61
-
62
-
63
-
64
-
65
-
66
-
67
-
68
-
69
-
70
-
71
-
72
-
73
-
74
-
75
-
76
-
77
-
78
-
79
-
80
-
81
-
82
-
83
-
84
-
85
-
86
-
87
-
88
-
89
-
90
-
91
-
92
-
93
-
94
-
95
-
96
-
97
-
98
-
99
-
100
-
 101
101 -
 102
102 -
 103
103 -
 104
104 -
 105
105 -
 106
106 -
 107
107 -
 108
108 -
 109
109 -
 110
110 -
 111
111 -
 112
112 -
 113
113 -
 114
114 -
 115
115 -
 116
116 -
 117
117 -
 118
118 -
 119
119 -
 120
120 -
 121
121 -
122
-
123
-
124
-
125
-
126
-
127
-
128
-
129
-
130
-
131
-
132
-
133
-
134
-
135
-
136
-
137
-
138
-
139
-
140
-
141
-
142
-
143
-
144
-
145
-
146
-
147
-
148
-
149
-
150
-
151
-
152
-
153
-
154
-
155
-
156
-
157
-
158
 |
 |
111
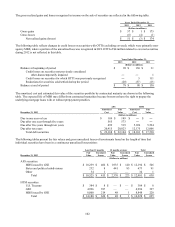
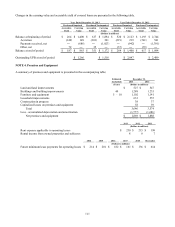
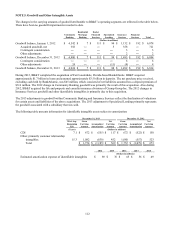
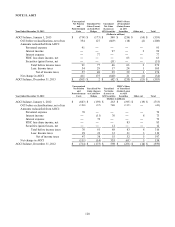
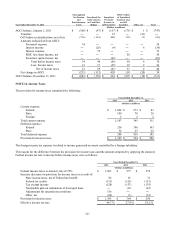
Changes in the carrying value and accretable yield of covered loans are presented in the following table.
Year Ended December 31, 2013 Year Ended December 31, 2012
Purchased Impaired Purchased Nonimpaired Purchased Impaired Purchased Nonimpaired
Accretable Carrying Accretable Carrying Accretable Carrying Accretable Carrying
Yield Value Yield Value Yield Value Yield Value
(Dollars in millions)
Balance at beginning of period $ 264 $ 1,400 $ 617 $ 1,894 $ 520 $ 2,123 $ 1,193 $ 2,744
Accretion (149) 149 (301) 301 (219) 219 (541) 541
Payments received, net ― (686) ― (1,023) ― (942) ― (1,391)
Other, net 72 ― 35 ― (37) ― (35) ―
Balance at end of period $ 187 $ 863 $ 351 $ 1,172 $ 264 $ 1,400 $ 617 $ 1,894
Outstanding UPB at end of period $ 1,266 $ 1,516 $ 2,047 $ 2,489
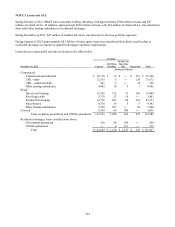
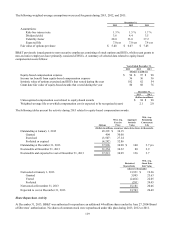
NOTE 4. Premises and Equipment
A summary of premises and equipment is presented in the accompanying table:
Estimated December 31,
Useful Life 2013 2012
(Years) (Dollars in millions)
Land and land improvements $ 527 $ 547
Buildings and building improvements 40 1,288 1,235
Furniture and equipment 5 - 10 1,102 1,141
Leasehold improvements 633 555
Construction in progress 38 37
Capitalized leases on premises and equipment 58 59
Total 3,646 3,574
Less - accumulated depreciation and amortization (1,777) (1,686)
N
et premises and equipmen
t
$ 1,869 $ 1,888
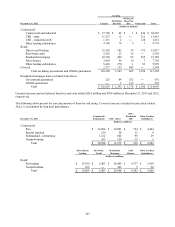
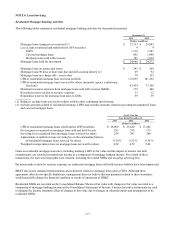
2013 2012 2011
(Dollars in millions)
Rent expense applicable to operating leases $ 230 $ 215 $ 199
Rental income from owned properties and subleases 8 8 7
2014 2015 2016 2017 2018 Thereafter
(Dollars in millions)
Future minimum lease payments for operating leases $ 214 $ 201 $ 182 $ 161 $ 136 $ 614