BB&T 2013 Annual Report Download - page 34
Download and view the complete annual report
Please find page 34 of the 2013 BB&T annual report below. You can navigate through the pages in the report by either clicking on the pages listed below, or by using the keyword search tool below to find specific information within the annual report.-
 1
1 -
2
-
3
-
4
-
5
-
6
-
7
-
8
-
9
-
10
-
11
-
12
-
13
-
14
-
15
-
16
-
17
-
18
-
19
-
20
-
21
-
22
-
23
-
 24
24 -
 25
25 -
 26
26 -
 27
27 -
 28
28 -
 29
29 -
 30
30 -
 31
31 -
 32
32 -
 33
33 -
 34
34 -
 35
35 -
 36
36 -
 37
37 -
 38
38 -
 39
39 -
 40
40 -
 41
41 -
 42
42 -
 43
43 -
 44
44 -
45
-
46
-
47
-
48
-
49
-
50
-
51
-
52
-
53
-
54
-
55
-
56
-
57
-
58
-
59
-
60
-
61
-
62
-
63
-
64
-
65
-
66
-
67
-
68
-
69
-
70
-
71
-
72
-
73
-
74
-
75
-
76
-
77
-
78
-
79
-
80
-
81
-
82
-
83
-
84
-
85
-
86
-
87
-
88
-
89
-
90
-
91
-
92
-
93
-
94
-
95
-
96
-
97
-
98
-
99
-
100
-
101
-
102
-
103
-
104
-
105
-
106
-
107
-
108
-
109
-
110
-
111
-
112
-
113
-
114
-
115
-
116
-
117
-
118
-
119
-
120
-
121
-
122
-
123
-
124
-
125
-
126
-
127
-
128
-
129
-
130
-
131
-
132
-
133
-
134
-
135
-
136
-
137
-
138
-
139
-
140
-
141
-
142
-
143
-
144
-
145
-
146
-
147
-
148
-
149
-
150
-
151
-
152
-
153
-
154
-
155
-
156
-
157
-
158
 |
 |

34
ITEM 7. MANAGEMENT’S DISCUSSION AND ANALYSIS OF FINANCIAL CONDITION AND RESULTS OF
OPERATIONS
Executive Overview
Significant accomplishments in 2013
The Company’s more significant accomplishments during 2013 were:
Record income before taxes of $3.1 billion, an 11.9% increase over the prior year.
Continued improvement in credit quality:
o NPAs, excluding covered assets, declined $483 million, or 31.4%. NPAs are at their lowest level since 2007.
o Net charge-offs as a percentage of average loans and leases were 0.67%, compared to 1.14% and 1.57% for
2012 and 2011, respectively.
o ALLL was 219% of net charge-offs at December 31, 2013, compared to 156% and 136% at December 31, 2012
and 2011, respectively.
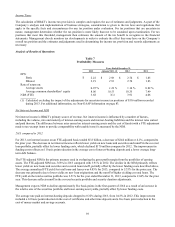
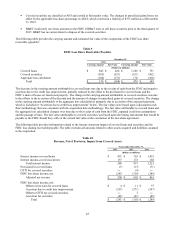
Growth in noninterest income was driven by record revenues in the insurance, investment banking and brokerage,
bankcard fees and merchant discounts, and trust and investment advisory LOBs.
Continued improvement in deposit mix and average cost:
o Average noninterest-bearing deposits increased 17.3% during 2013 and represented 26.4% of total average
deposits for 2013 compared to 22.7% in 2012.
o The average cost of interest-bearing deposits for 2013 was 0.32%, a decline of 11 basis points compared to the
prior year. The average cost was 0.28% for the fourth quarter of 2013.
Strong growth in all regulatory capital ratios throughout 2013:
o Tier 1 risk-based capital increased to 11.8% at year-end 2013, compared to 10.5% at year-end 2012.
o Total capital was 14.3% at year-end 2013, compared to 13.4% at year-end 2012.
o Leverage capital was 9.3% at year-end 2013, compared to 8.2% at year-end 2012.
Challenges
BB&T’s business has become more dynamic and complex in recent years. Consequently, management has annually
evaluated and, as necessary, adjusted the Company’s business strategy in the context of the current operating environment.
During this process, management considers the current financial condition and performance of the Company and its
expectations for future economic activity from both a national and local market perspective. The achievement of BB&T’s key
strategic objectives and established long-term financial goals is subject to many uncertainties and challenges. In the opinion
of management, the challenges that are most relevant and likely to have a near term impact on performance are presented
below:
Global economic uncertainty – including the impact of U.S. fiscal debt, budget and tax negotiations
Intense competition within the financial services industry given the challenge in growing assets during a period of
sustained low interest rates
Cost and risk associated with the regulatory reform and initiatives and IT projects