BB&T 2013 Annual Report Download - page 90
Download and view the complete annual report
Please find page 90 of the 2013 BB&T annual report below. You can navigate through the pages in the report by either clicking on the pages listed below, or by using the keyword search tool below to find specific information within the annual report.-
 1
1 -
2
-
3
-
4
-
5
-
6
-
7
-
8
-
9
-
10
-
11
-
12
-
13
-
14
-
15
-
16
-
17
-
18
-
19
-
20
-
21
-
22
-
23
-
24
-
25
-
26
-
27
-
28
-
29
-
30
-
31
-
32
-
33
-
34
-
35
-
36
-
37
-
38
-
39
-
40
-
41
-
42
-
43
-
44
-
45
-
46
-
47
-
48
-
49
-
50
-
51
-
52
-
53
-
54
-
55
-
56
-
57
-
58
-
59
-
60
-
61
-
62
-
63
-
64
-
65
-
66
-
67
-
68
-
69
-
70
-
71
-
72
-
73
-
74
-
75
-
76
-
77
-
78
-
79
-
 80
80 -
 81
81 -
 82
82 -
 83
83 -
 84
84 -
 85
85 -
 86
86 -
 87
87 -
 88
88 -
 89
89 -
 90
90 -
 91
91 -
 92
92 -
 93
93 -
 94
94 -
 95
95 -
 96
96 -
 97
97 -
 98
98 -
 99
99 -
 100
100 -
101
-
102
-
103
-
104
-
105
-
106
-
107
-
108
-
109
-
110
-
111
-
112
-
113
-
114
-
115
-
116
-
117
-
118
-
119
-
120
-
121
-
122
-
123
-
124
-
125
-
126
-
127
-
128
-
129
-
130
-
131
-
132
-
133
-
134
-
135
-
136
-
137
-
138
-
139
-
140
-
141
-
142
-
143
-
144
-
145
-
146
-
147
-
148
-
149
-
150
-
151
-
152
-
153
-
154
-
155
-
156
-
157
-
158
 |
 |

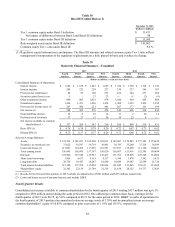
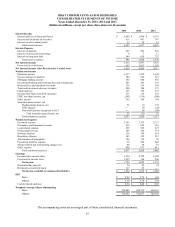
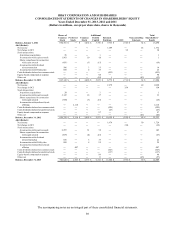
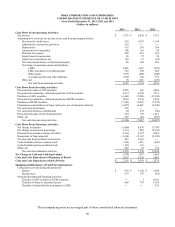
The accompanying notes are an integral part of these consolidated financial statements.
90
BB&T CORPORATION AND SUBSIDIARIES
CONSOLIDATED STATEMENTS OF CASH FLOWS
Years Ended December 31, 2013, 2012 and 2011
(Dollars in millions)
2013 2012 2011
Cash Flows From Operating Activities:
N
et income $ 1,729 $ 2,028 $ 1,332
Adjustments to reconcile net income to net cash from operating activities:
Provision for credit losses 592 1,057 1,190
Adjustment to income tax provision 516 ― ―
Depreciation 315 281 264
Amortization of intangibles 106 110 99
Deferred tax expense 288 419 185
Equity-based compensation 96 97 98
(Gain) loss on securities, net (51) 12 (62)
N
et write-downs/losses on foreclosed property 28 168 655
N
et change in operating assets and liabilities:
LHFS 2,445 (433) (583)
FDIC loss share receivable/payable 365 590 869
Other assets (273) (800) (240)
Accounts payable and other liabilities (812) 346 572
Other, net (5) (161) (103)
N
et cash from operating activities 5,339 3,714 4,276
Cash Flows From Investing Activities:
Proceeds from sales of AFS securities 2,209 303 4,006
Proceeds from maturities, calls and paydowns of AFS securities 6,214 4,396 3,271
Purchases of AFS securities (6,463) (7,026) (13,926)
Proceeds from maturities, calls and paydowns of HTM securities 2,863 5,536 1,828
Purchases of HTM securities (7,399) (5,055) (7,578)
Originations and purchases of loans and leases, net of principal collected (3,077) (6,651) (6,240)
N
et cash from divestitures 522 ― ―
N
et cash from business combinations (6) 675 (86)
Proceeds from sales of foreclosed property 394 799 1,017
Other, net 503 (24) (299)
N
et cash from investing activities (4,240) (7,047) (18,007)
Cash Flows From Financing Activities:
N
et change in deposits (5,600) 4,676 17,799
N
et change in short-term borrowings 1,274 (702) (2,107)
Proceeds from issuance of long-term debt 4,164 2,327 2,010
Repayment of long-term debt (1,634) (5,112) (2,190)
N
et proceeds from preferred stock issued 487 2,116 ―
Cash dividends paid on common stock (765) (531) (446)
Cash dividends paid on preferred stock (147) (33) ―
Other, net 248 55 154
N
et cash from financing activities (1,973) 2,796 15,220
Net Change in Cash and Cash Equivalents (874) (537) 1,489
Cash and Cash Equivalents at Beginning of Period 3,039 3,576 2,087
Cash and Cash Equivalents at End of Period $ 2,165 $ 3,039 $ 3,576
Supplemental Disclosure of Cash Flow Information:
Cash paid (received) during the period for:
Interest $ 918 $ 1,120 $ 1,404
Income taxes 677 347 (82)
N
oncash investing and financing activities:
Transfer of AFS securities to HTM securities ― 1 8,341
Transfers of loans to foreclosed assets 609 770 1,359
Transfers of loans held for investment to LHFS ― ― 226