BB&T 2013 Annual Report Download - page 83
Download and view the complete annual report
Please find page 83 of the 2013 BB&T annual report below. You can navigate through the pages in the report by either clicking on the pages listed below, or by using the keyword search tool below to find specific information within the annual report.-
 1
1 -
2
-
3
-
4
-
5
-
6
-
7
-
8
-
9
-
10
-
11
-
12
-
13
-
14
-
15
-
16
-
17
-
18
-
19
-
20
-
21
-
22
-
23
-
24
-
25
-
26
-
27
-
28
-
29
-
30
-
31
-
32
-
33
-
34
-
35
-
36
-
37
-
38
-
39
-
40
-
41
-
42
-
43
-
44
-
45
-
46
-
47
-
48
-
49
-
50
-
51
-
52
-
53
-
54
-
55
-
56
-
57
-
58
-
59
-
60
-
61
-
62
-
63
-
64
-
65
-
66
-
67
-
68
-
69
-
70
-
71
-
72
-
 73
73 -
 74
74 -
 75
75 -
 76
76 -
 77
77 -
 78
78 -
 79
79 -
 80
80 -
 81
81 -
 82
82 -
 83
83 -
 84
84 -
 85
85 -
 86
86 -
 87
87 -
 88
88 -
 89
89 -
 90
90 -
 91
91 -
 92
92 -
 93
93 -
94
-
95
-
96
-
97
-
98
-
99
-
100
-
101
-
102
-
103
-
104
-
105
-
106
-
107
-
108
-
109
-
110
-
111
-
112
-
113
-
114
-
115
-
116
-
117
-
118
-
119
-
120
-
121
-
122
-
123
-
124
-
125
-
126
-
127
-
128
-
129
-
130
-
131
-
132
-
133
-
134
-
135
-
136
-
137
-
138
-
139
-
140
-
141
-
142
-
143
-
144
-
145
-
146
-
147
-
148
-
149
-
150
-
151
-
152
-
153
-
154
-
155
-
156
-
157
-
158
 |
 |

83
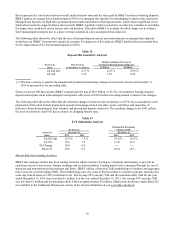
Total FTE revenues were $2.4 billion for the fourth quarter of 2013, down $151 million compared to the fourth quarter of
2012. The decrease in total revenues included a $116 million decline in FTE net interest income, primarily driven by lower
yields on new loans and the sale of a consumer lending subsidiary during October 2013. NIM was 3.56%, down 28 basis
points compared to the fourth quarter of 2012, which reflects covered loan run-off and lower yields on new loans and
securities, partially offset by lower funding costs. Noninterest income decreased $35 million, primarily attributable to a $131
million decline in mortgage banking income, partially offset by a $31 million gain on the sale of a consumer lending
subsidiary, a $22 million improvement in FDIC loss share income and other smaller increases.
Noninterest expense was $1.5 billion for the fourth quarter of 2013, a decrease of $32 million, or 2.2%, compared to the
fourth quarter of 2012. The decrease in noninterest expense was primarily due to a $37 million decline in foreclosed property
expense.
The provision for credit losses, excluding covered loans, for the fourth quarter of 2013 totaled $71 million, a decline of $185
million from the fourth quarter of 2012, as a result of continued improvement in credit quality. Net charge-offs, excluding
covered loans, for the fourth quarter of 2013 were $154 million lower than the fourth quarter of 2012 reflecting improved
credit quality. NPAs declined $483 million, or 31.4% compared to the fourth quarter of 2012.
The provision for income taxes was $243 million for the fourth quarter of 2013 compared to $207 million for the fourth
quarter of 2012. The effective tax rate for the fourth quarter of 2013 was 29.2% compared to 27.4% for the prior year’s fourth
quarter. The increase in the effective tax rate was primarily due to higher levels of pre-tax earnings relative to permanent tax
differences in 2013 compared to 2012.
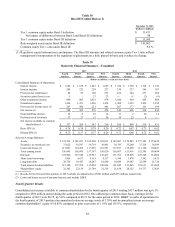
Non-GAAP Information
Certain amounts have been presented that exclude the effect of the $516 million of adjustments for uncertain income tax
positions that were recognized during 2013. BB&T believes these adjusted measures are meaningful as excluding the
adjustments increases the comparability of certain period-to-period results. The following table reconciles these adjusted
measures to their corresponding GAAP amount:
Table 40
Non-GAAP Reconciliations
Year Ended December 31, 2013 As Reported
Tax
Adjustments
Excluding Tax
Adjustments
(Dollars in millions, except per share data)
N
et income available to common shareholders $ 1,562 $ 516 $ 2,078
Weighted average number of diluted common shares (thousands) 714,363 714,363
Diluted EPS $ 2.19 $ 2.91
N
et income $ 1,729 $ 516 $ 2,245
Average assets 181,262 296 181,558
Return on average assets 0.95 % 1.24 %
N
et income available to common shareholders $ 1,562 $ 516 $ 2,078
Average common shareholders' equity 19,397 296 19,693
Return on average common shareholders' equity 8.06 % 10.55 %
Income before income taxes $ 3,124 $ 3,124
Provision for income taxes 1,395 $ (516) 879
Effective tax rate 44.7 % 28.1 %