BB&T 2013 Annual Report Download - page 124
Download and view the complete annual report
Please find page 124 of the 2013 BB&T annual report below. You can navigate through the pages in the report by either clicking on the pages listed below, or by using the keyword search tool below to find specific information within the annual report.-
 1
1 -
2
-
3
-
4
-
5
-
6
-
7
-
8
-
9
-
10
-
11
-
12
-
13
-
14
-
15
-
16
-
17
-
18
-
19
-
20
-
21
-
22
-
23
-
24
-
25
-
26
-
27
-
28
-
29
-
30
-
31
-
32
-
33
-
34
-
35
-
36
-
37
-
38
-
39
-
40
-
41
-
42
-
43
-
44
-
45
-
46
-
47
-
48
-
49
-
50
-
51
-
52
-
53
-
54
-
55
-
56
-
57
-
58
-
59
-
60
-
61
-
62
-
63
-
64
-
65
-
66
-
67
-
68
-
69
-
70
-
71
-
72
-
73
-
74
-
75
-
76
-
77
-
78
-
79
-
80
-
81
-
82
-
83
-
84
-
85
-
86
-
87
-
88
-
89
-
90
-
91
-
92
-
93
-
94
-
95
-
96
-
97
-
98
-
99
-
100
-
101
-
102
-
103
-
104
-
105
-
106
-
107
-
108
-
109
-
110
-
111
-
112
-
113
-
 114
114 -
 115
115 -
 116
116 -
 117
117 -
 118
118 -
 119
119 -
 120
120 -
 121
121 -
 122
122 -
 123
123 -
 124
124 -
 125
125 -
 126
126 -
 127
127 -
 128
128 -
 129
129 -
 130
130 -
 131
131 -
 132
132 -
 133
133 -
 134
134 -
135
-
136
-
137
-
138
-
139
-
140
-
141
-
142
-
143
-
144
-
145
-
146
-
147
-
148
-
149
-
150
-
151
-
152
-
153
-
154
-
155
-
156
-
157
-
158
 |
 |

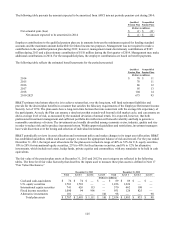
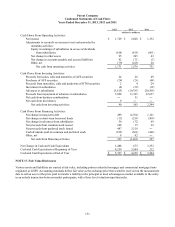
124
Years Ended December 31,
2013 2012 2011
(Dollars in millions)
N
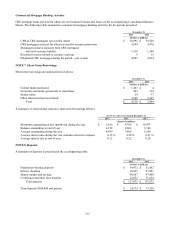
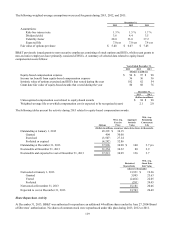
et Periodic Pension Cost:
Service cost $ 150 $ 120 $ 105
Interest cost 120 110 103
Estimated return on plan assets (257) (200) (197)
N
et amortization and othe
r
91 76 34
N
et periodic benefit cost 104 106 45
Pre-Tax Amounts Recognized in Total Comprehensive Income:
N
et actuarial loss (gain) (535) 270 388
N
et amortization (91) (76) (34)
N
et amount recognized in OCI (626) 194 354
Total net periodic pension costs (income) recognized in
total comprehensive income, pre-tax $ (522) $ 300 $ 399
The following actuarial assumptions were used to determine benefit obligations:
December 31,
2013 2012
Weighted average assumed discount rate 5.10 % 4.25 %
Assumed rate of annual compensation increases 5.00 4.50
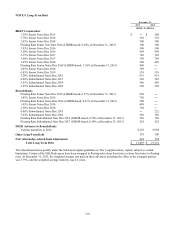
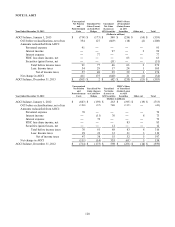
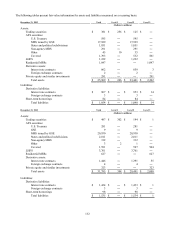
Qualified Pension Plan Nonqualified Pension Plans
Years Ended December 31, Years Ended December 31,
2013 2012 2013 2012
(Dollars in millions)
Projected benefit obligation, beginning of year $ 2,548 $ 2,055 $ 287 $ 207
Service cost 139 113 11 7
Interest cost 107 100 12 10
Actuarial (gain) loss (294) 296 2 70
Benefits paid (63) (57) (8) (7)
Acquisitions ― 41 ― ―
Projected benefit obligation, end of year $ 2,437 $ 2,548 $ 304 $ 287
Accumulated benefit obligation, end of year $ 2,062 $ 2,166 $ 215 $ 213
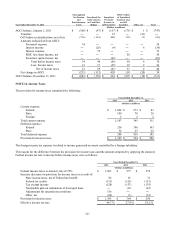
Qualified Pension Plan Nonqualified Pension Plans
Years Ended December 31, Years Ended December 31,
2013 2012 2013 2012
(Dollars in millions)
Fair value of plan assets, beginning of year $ 2,952 $ 2,478 $ — $ —
Actual return on plan assets 499 295 — —
Employer contributions 345 202 8 7
Benefits paid (63) (57) (8) (7)
Acquisitions — 34 — —
Fair value of plan assets, end of year $ 3,733 $ 2,952 $ — $ —
Funded status at end of year $ 1,296 $ 404 $ (304) $ (287)
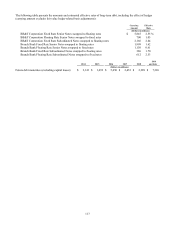
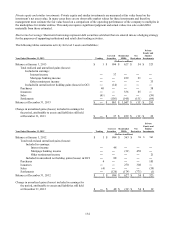
The following are the pre-tax amounts recognized in AOCI:
Qualified Pension Plan Nonqualified Pension Plans
Years Ended December 31, Years Ended December 31,
2013 2012 2013 2012
(Dollars in millions)
Prior service credit (cost) $ - $ 1 $ (2) $ (1)
N
et actuarial loss (377) (993) (117) (128)
N
et amount recognized $ (377) $ (992) $ (119) $ (129)