BB&T 2013 Annual Report Download - page 48
Download and view the complete annual report
Please find page 48 of the 2013 BB&T annual report below. You can navigate through the pages in the report by either clicking on the pages listed below, or by using the keyword search tool below to find specific information within the annual report.-
 1
1 -
2
-
3
-
4
-
5
-
6
-
7
-
8
-
9
-
10
-
11
-
12
-
13
-
14
-
15
-
16
-
17
-
18
-
19
-
20
-
21
-
22
-
23
-
24
-
25
-
26
-
27
-
28
-
29
-
30
-
31
-
32
-
33
-
34
-
35
-
36
-
37
-
 38
38 -
 39
39 -
 40
40 -
 41
41 -
 42
42 -
 43
43 -
 44
44 -
 45
45 -
 46
46 -
 47
47 -
 48
48 -
 49
49 -
 50
50 -
 51
51 -
 52
52 -
 53
53 -
 54
54 -
 55
55 -
 56
56 -
 57
57 -
 58
58 -
59
-
60
-
61
-
62
-
63
-
64
-
65
-
66
-
67
-
68
-
69
-
70
-
71
-
72
-
73
-
74
-
75
-
76
-
77
-
78
-
79
-
80
-
81
-
82
-
83
-
84
-
85
-
86
-
87
-
88
-
89
-
90
-
91
-
92
-
93
-
94
-
95
-
96
-
97
-
98
-
99
-
100
-
101
-
102
-
103
-
104
-
105
-
106
-
107
-
108
-
109
-
110
-
111
-
112
-
113
-
114
-
115
-
116
-
117
-
118
-
119
-
120
-
121
-
122
-
123
-
124
-
125
-
126
-
127
-
128
-
129
-
130
-
131
-
132
-
133
-
134
-
135
-
136
-
137
-
138
-
139
-
140
-
141
-
142
-
143
-
144
-
145
-
146
-
147
-
148
-
149
-
150
-
151
-
152
-
153
-
154
-
155
-
156
-
157
-
158
 |
 |
48
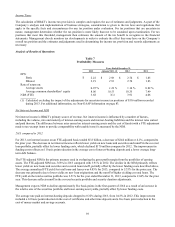
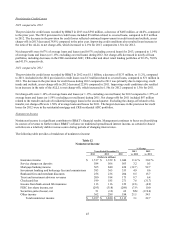
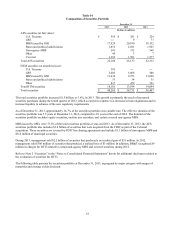
2013 compared to 2012
Personnel expense is the largest component of noninterest expense and includes salaries, wages and incentives, as well as
pension and other employee benefit costs. Personnel expense totaled $3.3 billion, an increase of $168 million, or 5.4%,
compared to 2012. The increase in personnel expense includes an increase of $128 million in salaries and wages, which
reflects increases related to the acquisitions of Crump Insurance and BankAtlantic during 2012 and the impact of normal
salary increases and job class changes. Other personnel expenses increased approximately $40 million, which included an
increase of $22 million in post-employment benefits expense that is offset in other income. The remainder of the increase in
other personnel expenses was driven by smaller increases in employment taxes and other fringe benefits.
Occupancy and equipment expense increased $42 million, or 6.5%, compared to 2012, with a portion of this increase
attributable to the acquisitions of Crump Insurance and BankAtlantic acquisitions in the prior year and the remainder
attributable to increases in rent and IT-related depreciation and maintenance.
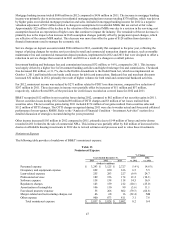
Professional services expense totaled $189 million, an increase of $33 million compared to the prior year. This increase was
largely driven by costs associated with systems and project-related expenses, partially offset by a decrease in legal fees.
Other expense increased $27 million, or 3.1%, compared to 2012, primarily the result of higher project-related expenses,
increased depreciation expense related to assets used in the equipment finance leasing business and lower of cost or fair value
adjustments on certain owned real estate. These increases were partially offset by a decrease in advertising and marketing
expenses, lower insurance-related expenses and the loss on the sale of a leveraged lease that was recorded in the prior year.
Software expense increased $20 million compared to the prior year, which primarily reflects higher maintenance and
depreciation expense.
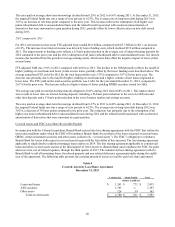
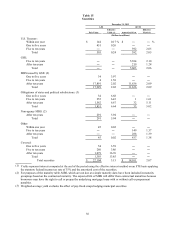
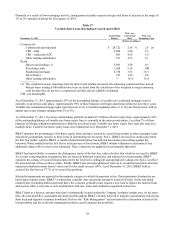
Foreclosed property expense includes the gain or loss on sale of foreclosed property, valuation adjustments resulting from
updated appraisals and the ongoing expense of maintaining foreclosed properties. Foreclosed property expense decreased
$211 million, or 79.3% in 2013, due to fewer losses and write-downs and lower maintenance costs on foreclosed property.
Loan-related expense totaled $255 million, a decrease of $28 million, or 9.9% compared to the prior year. This decrease was
primarily the result of improvements in mortgage repurchase expense and lower costs associated with certain mortgage loan
indemnifications.
Merger-related and restructuring charges were $22 million lower than the prior year, which reflects the impact of merger-
related charges associated with the Crump Insurance and BankAtlantic acquisitions in the prior year, partially offset by
restructuring charges associated with optimization activities in Community Banking that were initiated during the second
quarter of 2013. Regulatory charges decreased $16 million in 2013 due to improved credit quality, which led to lower deposit
insurance premiums.
Management currently expects that total noninterest expense should trend lower throughout 2014, largely driven by lower
personnel expense, professional services and regulatory charges. This decrease in noninterest expense, along with an
anticipated increase in noninterest income, is expected to lead to continued improvement in the efficiency ratio throughout
2014, down to the mid-fifties by the fourth quarter.
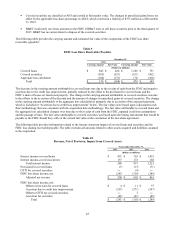
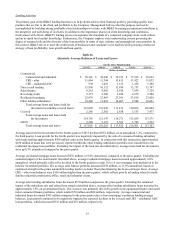
2012 compared to 2011
Total personnel expense increased 14.6% during 2012, primarily the result of the Crump Insurance and BankAtlantic
acquisitions during 2012. Other factors contributing to this increase include normal salary increases, higher production-
related incentives and commissions and other performance incentives and higher pension expense related to certain changes
in actuarial assumptions. Additional disclosures relating to BB&T’s benefit plans can be found in Note 13 “Benefit Plans” in
the “Notes to Consolidated Financial Statements.”
Occupancy and equipment expense increased $34 million, or 5.5%, compared to 2011, primarily due to the acquisitions of
Crump Insurance and BankAtlantic.
Loan-related expense totaled $283 million, an increase of $56 million compared to the prior year. This increase was primarily
the result of higher investor-owned loan expense and provisions for higher mortgage repurchase reserves.
Foreclosed property expense decreased $536 million, or 66.8% in 2012, primarily reflecting the impact of a more aggressive
approach to reducing the inventory of foreclosed property that was undertaken in the fourth quarter of 2011.