BB&T 2013 Annual Report Download - page 68
Download and view the complete annual report
Please find page 68 of the 2013 BB&T annual report below. You can navigate through the pages in the report by either clicking on the pages listed below, or by using the keyword search tool below to find specific information within the annual report.-
 1
1 -
2
-
3
-
4
-
5
-
6
-
7
-
8
-
9
-
10
-
11
-
12
-
13
-
14
-
15
-
16
-
17
-
18
-
19
-
20
-
21
-
22
-
23
-
24
-
25
-
26
-
27
-
28
-
29
-
30
-
31
-
32
-
33
-
34
-
35
-
36
-
37
-
38
-
39
-
40
-
41
-
42
-
43
-
44
-
45
-
46
-
47
-
48
-
49
-
50
-
51
-
52
-
53
-
54
-
55
-
56
-
57
-
 58
58 -
 59
59 -
 60
60 -
 61
61 -
 62
62 -
 63
63 -
 64
64 -
 65
65 -
 66
66 -
 67
67 -
 68
68 -
 69
69 -
 70
70 -
 71
71 -
 72
72 -
 73
73 -
 74
74 -
 75
75 -
 76
76 -
 77
77 -
 78
78 -
79
-
80
-
81
-
82
-
83
-
84
-
85
-
86
-
87
-
88
-
89
-
90
-
91
-
92
-
93
-
94
-
95
-
96
-
97
-
98
-
99
-
100
-
101
-
102
-
103
-
104
-
105
-
106
-
107
-
108
-
109
-
110
-
111
-
112
-
113
-
114
-
115
-
116
-
117
-
118
-
119
-
120
-
121
-
122
-
123
-
124
-
125
-
126
-
127
-
128
-
129
-
130
-
131
-
132
-
133
-
134
-
135
-
136
-
137
-
138
-
139
-
140
-
141
-
142
-
143
-
144
-
145
-
146
-
147
-
148
-
149
-
150
-
151
-
152
-
153
-
154
-
155
-
156
-
157
-
158
 |
 |

68
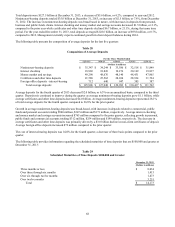
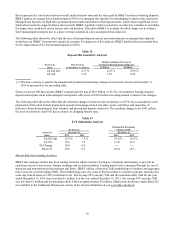
Total deposits were $127.5 billion at December 31, 2013, a decrease of $5.6 billion, or 4.2%, compared to year-end 2012.
Noninterest-bearing deposits totaled $35.0 billion at December 31, 2013, an increase of $2.5 billion, or 7.8%, from December
31, 2012. The increase in noninterest-bearing deposits was broad based in nature, with increases in deposits from personal,
business and public funds clients. Interest checking and money market and savings accounts decreased $1.5 billion, or 2.1%,
compared to the prior year while certificates and other time deposits declined $6.7 billion, or 21.1%, during that same time
period. For the year ended December 31, 2013, total deposits averaged $128.6 billion, an increase of $938 million, or 0.7%,
compared to 2012. Management currently expects continued growth in client deposit balances during 2014.
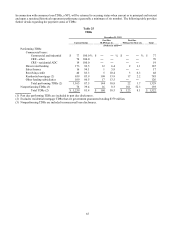
The following table presents the composition of average deposits for the last five quarters:
Table 28
Composition of Average Deposits
For the Three Months Ended
12/31/13 9/30/13 6/30/13 3/31/13 12/31/12
(Dollars in millions)
N
oninteres
t
-bearing deposits $ 35,347 $ 34,244 $ 33,586 $ 32,518 $ 31,849
Interest checking 18,969 18,826 19,276 20,169 19,837
Money market and savings 49,298 48,676 48,140 48,431 47,965
Certificates and other time deposits 21,580 25,562 28,034 28,934 31,724
Foreign office deposits - interest-bearing 712 640 947 385 387
Total average deposits $ 125,906 $ 127,948 $ 129,983 $ 130,437 $ 131,762
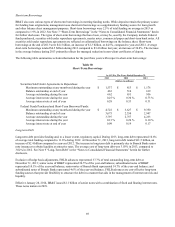
Average deposits for the fourth quarter of 2013 decreased $2.0 billion, or 6.3% on an annualized basis, compared to the third
quarter. Deposit mix continued to improve during the quarter as average noninterest-bearing deposits grew $1.1 billion, while
average certificates and other time deposits decreased $4.0 billion. Average noninterest-bearing deposits represented 28.1%
of total average deposits for the fourth quarter compared to 26.8% for the prior quarter.
Growth in average noninterest-bearing deposits was broad-based, with increases in deposits related to commercial, public
funds and personal accounts totaling $500 million, $347 million and $171 million, respectively. Average interest-checking
and money market and savings accounts increased $765 million compared to the prior quarter, reflecting growth in personal,
public funds and commercial accounts totaling $312 million, $254 million and $199 million, respectively. The decrease in
average certificates and other time deposits was primarily driven by a $3.0 billion decline in non-client certificates of deposit.
Average foreign office deposits increased $72 million compared to the prior quarter.
The cost of interest-bearing deposits was 0.28% for the fourth quarter, a decrease of three basis points compared to the prior
quarter.
The following table provides information regarding the scheduled maturities of time deposits that are $100,000 and greater at
December 31, 2013:
Table 29
Scheduled Maturities of Time Deposits $100,000 and Greater
December 31, 2013
(Dollars in millions)
Three months or less $ 8,034
Over three through six months 1,415
Over six through twelve months 1,473
Over twelve months 3,251
Total $ 14,173