BB&T 2013 Annual Report Download - page 66
Download and view the complete annual report
Please find page 66 of the 2013 BB&T annual report below. You can navigate through the pages in the report by either clicking on the pages listed below, or by using the keyword search tool below to find specific information within the annual report.-
 1
1 -
2
-
3
-
4
-
5
-
6
-
7
-
8
-
9
-
10
-
11
-
12
-
13
-
14
-
15
-
16
-
17
-
18
-
19
-
20
-
21
-
22
-
23
-
24
-
25
-
26
-
27
-
28
-
29
-
30
-
31
-
32
-
33
-
34
-
35
-
36
-
37
-
38
-
39
-
40
-
41
-
42
-
43
-
44
-
45
-
46
-
47
-
48
-
49
-
50
-
51
-
52
-
53
-
54
-
55
-
 56
56 -
 57
57 -
 58
58 -
 59
59 -
 60
60 -
 61
61 -
 62
62 -
 63
63 -
 64
64 -
 65
65 -
 66
66 -
 67
67 -
 68
68 -
 69
69 -
 70
70 -
 71
71 -
 72
72 -
 73
73 -
 74
74 -
 75
75 -
 76
76 -
77
-
78
-
79
-
80
-
81
-
82
-
83
-
84
-
85
-
86
-
87
-
88
-
89
-
90
-
91
-
92
-
93
-
94
-
95
-
96
-
97
-
98
-
99
-
100
-
101
-
102
-
103
-
104
-
105
-
106
-
107
-
108
-
109
-
110
-
111
-
112
-
113
-
114
-
115
-
116
-
117
-
118
-
119
-
120
-
121
-
122
-
123
-
124
-
125
-
126
-
127
-
128
-
129
-
130
-
131
-
132
-
133
-
134
-
135
-
136
-
137
-
138
-
139
-
140
-
141
-
142
-
143
-
144
-
145
-
146
-
147
-
148
-
149
-
150
-
151
-
152
-
153
-
154
-
155
-
156
-
157
-
158
 |
 |

66
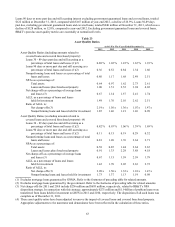
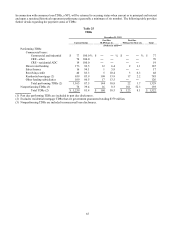
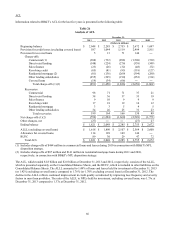
ACL
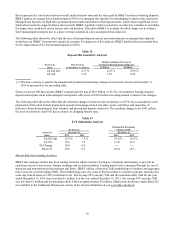
Information related to BB&T’s ACL for the last five years is presented in the following table:
Table 26
Analysis of ACL
December 31,
2013 2012 2011 2010 2009
(Dollars in millions)
Beginning balance $ 2,048 $ 2,285 $ 2,755 $ 2,672 $ 1,607
Provision for credit losses (excluding covered loans) 587 1,044 1,119 2,494 2,811
Provision for covered loans 5 13 71 144 ―
Charge-offs:
Commercial (1) (380) (732) (898) (1,508) (720)
Direct retail lending (148) (224) (276) (338) (349)
Sales finance (23) (26) (32) (48) (72)
Revolving credit (85) (81) (95) (118) (127)
Residential mortgage (2) (81) (136) (269) (394) (280)
Other lending subsidiaries (255) (225) (190) (252) (314)
Covered loans (19) (34) (66) ― ―
Total charge-offs (1)(2) (991) (1,458) (1,826) (2,658) (1,862)
Recoveries:
Commercial 98 71 71 37 21
Direct retail lending 38 36 37 33 19
Sales finance 9 10 9 9 9
Revolving credit 17 18 19 16 12
Residential mortgage 3 3 5 4 5
Other lending subsidiaries 34 26 25 31 23
Total recoveries 199 164 166 130 89
N
et charge-offs (1)(2) (792) (1,294) (1,660) (2,528) (1,773)
Other changes, net (27) ― ― (27) 27
Ending balance $ 1,821 $ 2,048 $ 2,285 $ 2,755 $ 2,672
ALLL (excluding covered loans) $ 1,618 $ 1,890 $ 2,107 $ 2,564 $ 2,600
Allowance for covered loans 114 128 149 144 ―
RUFC 89 30 29 47 72
Total ACL $ 1,821 $ 2,048 $ 2,285 $ 2,755 $ 2,672
(1) Includes charge-offs of $464 million in commercial loans and leases during 2010 in connection with BB&T's NPL
disposition strategy.
(2) Includes charge-offs of $87 million and $141 million in residential mortgage loans during 2011 and 2010,
respectively, in connection with BB&T's NPL disposition strategy.
The ACL, which totaled $1.8 billion and $2.0 billion at December 31, 2013 and 2012, respectively, consists of the ALLL,
which is presented separately on the Consolidated Balance Sheets, and the RUFC, which is included in other liabilities on the
Consolidated Balance Sheets. The ALLL amounted to 1.49% of loans and leases held for investment at December 31, 2013
(or 1.42% excluding covered loans), compared to 1.76% (or 1.70% excluding covered loans) at December 31, 2012. The
decline in the ALLL reflects continued improvement in credit quality as indicated by improving loss frequency and severity
factors in most loan portfolios. The ratio of the ALLL to NPLs held for investment, excluding covered loans, was 1.73x at
December 31, 2013 compared to 1.37x at December 31, 2012.