BB&T 2013 Annual Report Download - page 137
Download and view the complete annual report
Please find page 137 of the 2013 BB&T annual report below. You can navigate through the pages in the report by either clicking on the pages listed below, or by using the keyword search tool below to find specific information within the annual report.-
 1
1 -
2
-
3
-
4
-
5
-
6
-
7
-
8
-
9
-
10
-
11
-
12
-
13
-
14
-
15
-
16
-
17
-
18
-
19
-
20
-
21
-
22
-
23
-
24
-
25
-
26
-
27
-
28
-
29
-
30
-
31
-
32
-
33
-
34
-
35
-
36
-
37
-
38
-
39
-
40
-
41
-
42
-
43
-
44
-
45
-
46
-
47
-
48
-
49
-
50
-
51
-
52
-
53
-
54
-
55
-
56
-
57
-
58
-
59
-
60
-
61
-
62
-
63
-
64
-
65
-
66
-
67
-
68
-
69
-
70
-
71
-
72
-
73
-
74
-
75
-
76
-
77
-
78
-
79
-
80
-
81
-
82
-
83
-
84
-
85
-
86
-
87
-
88
-
89
-
90
-
91
-
92
-
93
-
94
-
95
-
96
-
97
-
98
-
99
-
100
-
101
-
102
-
103
-
104
-
105
-
106
-
107
-
108
-
109
-
110
-
111
-
112
-
113
-
114
-
115
-
116
-
117
-
118
-
119
-
120
-
121
-
122
-
123
-
124
-
125
-
126
-
 127
127 -
 128
128 -
 129
129 -
 130
130 -
 131
131 -
 132
132 -
 133
133 -
 134
134 -
 135
135 -
 136
136 -
 137
137 -
 138
138 -
 139
139 -
 140
140 -
 141
141 -
 142
142 -
 143
143 -
 144
144 -
 145
145 -
 146
146 -
 147
147 -
148
-
149
-
150
-
151
-
152
-
153
-
154
-
155
-
156
-
157
-
158
 |
 |

137
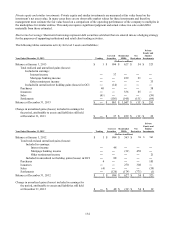
Contractual commitments: The fair values of commitments are estimated using the fees charged to enter into similar
agreements, taking into account the remaining terms of the agreements and the present creditworthiness of the counterparties.
For fixed-rate loan commitments, fair values also consider the difference between current levels of interest rates and the
committed rates. The fair values of guarantees and letters of credit are estimated based on the counterparties’
creditworthiness and average default rates for loan products with similar risks. These respective fair value measurements are
categorized within Level 3 of the fair value hierarchy.
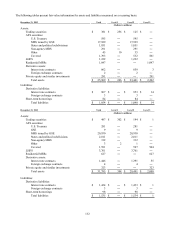
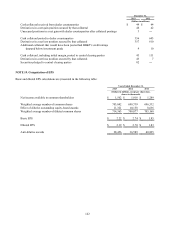
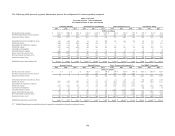
Financial assets and liabilities not recorded at fair value are summarized below:
Carrying Total
December 31, 2013 Amount Fair Value Level 2 Level 3
(Dollars in millions)
Financial assets:
HTM securities $ 18,101 $ 17,530 $ 17,491 $ 39
Loans and leases, net of ALLL excluding covered loans 112,264 112,261 ― 112,261
Covered loans, net of ALLL 1,921 2,200 ― 2,200
FDIC loss share receivable 843 464 ― 464
Financial liabilities:
Deposits 127,475 127,810 127,810 ―
FDIC loss share payable 669 652 ― 652
Long-term debt 21,493 22,313 22,313 ―
Carrying Total
December 31, 2012 Amount Fair Value Level 2 Level 3
(Dollars in millions)
Financial assets:
HTM securities $ 13,594 $ 13,848 $ 13,810 $ 38
Loans and leases, net of ALLL excluding covered loans 109,419 109,621 ― 109,621
Covered loans, net of ALLL 3,166 3,661 ― 3,661
FDIC loss share receivable 1,106 751 ― 751
Financial liabilities:
Deposits 133,075 133,377 133,377 ―
FDIC loss share payable 627 602 ― 602
Long-term debt 19,114 20,676 20,676 ―
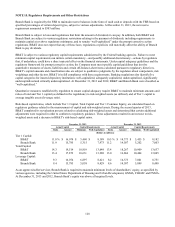
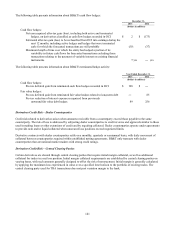
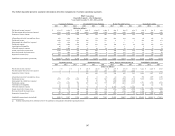
The following is a summary of selected information pertaining to off-balance sheet financial instruments:
December 31, 2013 December 31, 2012
Notional/ Notional/
Contract Contract
Amount Fair Value Amount Fair Value
(Dollars in millions)
Commitments to extend, originate or purchase credit $ 45,333 $ 86 $ 41,410 $ 74
Residential mortgage loans sold with recourse 783 13 1,019 12
Other loans sold with recourse 4,594 9 4,970 13
Letters of credit and financial guarantees written 4,355 39 5,164 30