BB&T 2013 Annual Report Download - page 60
Download and view the complete annual report
Please find page 60 of the 2013 BB&T annual report below. You can navigate through the pages in the report by either clicking on the pages listed below, or by using the keyword search tool below to find specific information within the annual report.-
 1
1 -
2
-
3
-
4
-
5
-
6
-
7
-
8
-
9
-
10
-
11
-
12
-
13
-
14
-
15
-
16
-
17
-
18
-
19
-
20
-
21
-
22
-
23
-
24
-
25
-
26
-
27
-
28
-
29
-
30
-
31
-
32
-
33
-
34
-
35
-
36
-
37
-
38
-
39
-
40
-
41
-
42
-
43
-
44
-
45
-
46
-
47
-
48
-
49
-
 50
50 -
 51
51 -
 52
52 -
 53
53 -
 54
54 -
 55
55 -
 56
56 -
 57
57 -
 58
58 -
 59
59 -
 60
60 -
 61
61 -
 62
62 -
 63
63 -
 64
64 -
 65
65 -
 66
66 -
 67
67 -
 68
68 -
 69
69 -
 70
70 -
71
-
72
-
73
-
74
-
75
-
76
-
77
-
78
-
79
-
80
-
81
-
82
-
83
-
84
-
85
-
86
-
87
-
88
-
89
-
90
-
91
-
92
-
93
-
94
-
95
-
96
-
97
-
98
-
99
-
100
-
101
-
102
-
103
-
104
-
105
-
106
-
107
-
108
-
109
-
110
-
111
-
112
-
113
-
114
-
115
-
116
-
117
-
118
-
119
-
120
-
121
-
122
-
123
-
124
-
125
-
126
-
127
-
128
-
129
-
130
-
131
-
132
-
133
-
134
-
135
-
136
-
137
-
138
-
139
-
140
-
141
-
142
-
143
-
144
-
145
-
146
-
147
-
148
-
149
-
150
-
151
-
152
-
153
-
154
-
155
-
156
-
157
-
158
 |
 |

60
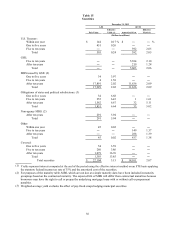
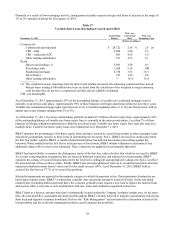
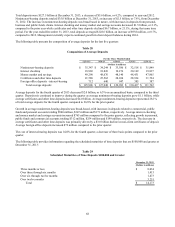
Table 20
Selected Loan Maturities and Interest Sensitivity
December 31, 2013
Commercial, Real Estate:
Financial Construction
and and Land
Agricultural Development Total
(Dollars in millions)
Fixed Rate:
1 year or less (1) $ 2,628 $ 183 $ 2,811
1-5 years 3,075 515 3,590
After 5 years 4,167 1,014 5,181
Total 9,870 1,712 11,582
Variable Rate:
1 year or less (1) 4,087 979 5,066
1-5 years 8,734 1,431 10,165
After 5 years 2,569 508 3,077
Total 15,390 2,918 18,308
Total loans and leases (2) $ 25,260 $ 4,630 $ 29,890
(1) Includes loans due on demand.
(2) The above table excludes: (Dollars in millions)
(i) consumer $ 19,416
(ii) real estate mortgage 65,485
(iii) LHFS 1,222
(iv) lease receivables 1,126
Total $ 87,249
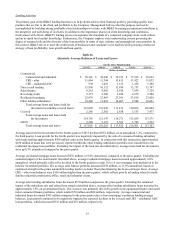
Asset Quality
The following discussion excludes assets covered by FDIC loss sharing agreements that provide for reimbursement to BB&T
for the majority of losses incurred on those assets. Covered loans, which are considered performing due to the application of
the expected cash flows method, were $2.0 billion at December 31, 2013 and $3.3 billion in the prior year. Covered
foreclosed real estate totaled $121 million and $254 million at December 31, 2013 and 2012, respectively.
NPAs, which include foreclosed real estate, repossessions and nonaccrual loans, totaled $1.1 billion at December 31, 2013
compared to $1.5 billion at December 31, 2012. The decline in NPAs of $483 million was driven by decreases of $445
million in NPLs and $38 million in foreclosed property. The decline in NPLs included a $359 million reduction in the
commercial loan portfolio and smaller declines in other lending subsidiaries, residential mortgage and direct retail lending
totaling $35 million, $26 million and $23 million, respectively. The inventory of foreclosed real estate as of December 31,
2013 includes land and lots totaling $10 million that have been held for approximately five months on average. The
remaining foreclosed real estate of $61 million, which is primarily single family residential and CRE, had an average holding
period of four months. NPAs as a percentage of loans and leases plus foreclosed property were 0.91% at December 31, 2013
compared with 1.33% at December 31, 2012.
Management expects NPAs to decline at a modest pace during the first quarter of 2014, assuming no significant economic
deterioration during the quarter.