BB&T 2013 Annual Report Download - page 62
Download and view the complete annual report
Please find page 62 of the 2013 BB&T annual report below. You can navigate through the pages in the report by either clicking on the pages listed below, or by using the keyword search tool below to find specific information within the annual report.-
 1
1 -
2
-
3
-
4
-
5
-
6
-
7
-
8
-
9
-
10
-
11
-
12
-
13
-
14
-
15
-
16
-
17
-
18
-
19
-
20
-
21
-
22
-
23
-
24
-
25
-
26
-
27
-
28
-
29
-
30
-
31
-
32
-
33
-
34
-
35
-
36
-
37
-
38
-
39
-
40
-
41
-
42
-
43
-
44
-
45
-
46
-
47
-
48
-
49
-
50
-
51
-
 52
52 -
 53
53 -
 54
54 -
 55
55 -
 56
56 -
 57
57 -
 58
58 -
 59
59 -
 60
60 -
 61
61 -
 62
62 -
 63
63 -
 64
64 -
 65
65 -
 66
66 -
 67
67 -
 68
68 -
 69
69 -
 70
70 -
 71
71 -
 72
72 -
73
-
74
-
75
-
76
-
77
-
78
-
79
-
80
-
81
-
82
-
83
-
84
-
85
-
86
-
87
-
88
-
89
-
90
-
91
-
92
-
93
-
94
-
95
-
96
-
97
-
98
-
99
-
100
-
101
-
102
-
103
-
104
-
105
-
106
-
107
-
108
-
109
-
110
-
111
-
112
-
113
-
114
-
115
-
116
-
117
-
118
-
119
-
120
-
121
-
122
-
123
-
124
-
125
-
126
-
127
-
128
-
129
-
130
-
131
-
132
-
133
-
134
-
135
-
136
-
137
-
138
-
139
-
140
-
141
-
142
-
143
-
144
-
145
-
146
-
147
-
148
-
149
-
150
-
151
-
152
-
153
-
154
-
155
-
156
-
157
-
158
 |
 |

62
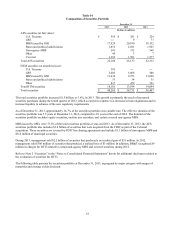
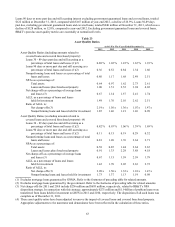
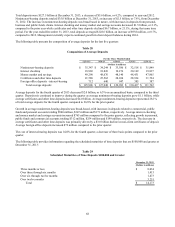
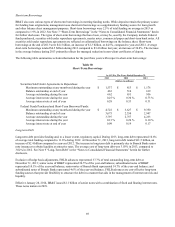
Table 22
Asset Quality (Excluding Covered Assets)
December 31,
2013 2012 2011 2010 2009
(Dollars in millions)
N
onaccrual loans and leases:
Commercial $ 527 $ 886 $ 1,352 $ 1,426 $ 1,651
Direct retail lending 109 132 142 191 197
Sales finance loans 5 7 7 6 7
Residential mortgage loans (1) 243 269 308 466 707
Other lending subsidiaries 51 86 63 60 96
Total nonaccrual loans and leases held for investment 935 1,380 1,872 2,149 2,658
N
onaccrual LHFS ― ― ― 521 5
Total nonaccrual loans and leases 935 1,380 1,872 2,670 2,663
Foreclosed real estate (2) 71 107 536 1,259 1,451
Other foreclosed property 47 49 42 42 58
Total NPAs (1)(2) $ 1,053 $ 1,536 $ 2,450 $ 3,971 $ 4,172
Loans 90 days or more past due and still accruing:
Commercial $ ― $ 1 $ 2 $ 20 $ 7
Direct retail lending 33 38 56 79 87
Sales finance loans 5 10 18 27 30
Revolving credit loans 10 16 17 20 25
Residential mortgage loans (3)(4) 69 92 104 143 150
Other lending subsidiaries 5 10 5 6 12
Total loans 90 days or more past due and still
accruing (3)(4)(5) $ 122 $ 167 $ 202 $ 295 $ 311
Loans 30-89 days past due:
Commercial $ 45 $ 56 $ 121 $ 315 $ 377
Direct retail lending 132 145 162 190 222
Sales finance loans 56 56 75 95 126
Revolving credit loans 23 23 22 28 32
Residential mortgage loans (6)(7) 463 498 479 532 600
Other lending subsidiaries 221 290 273 248 306
Total loans 30 - 89 days past due (6)(7)(8) $ 940 $ 1,068 $ 1,132 $ 1,408 $ 1,663
(1) Excludes nonaccrual mortgage loans that are government guaranteed totaling $55 million as of December 31, 2009.
BB&T revised its nonaccrual policy related to FHA/VA guaranteed loans during 2010. The change in policy resulted in a
decrease in nonaccrual mortgage loans and an increase in mortgage loans 90 days past due and still accruing of
approximately $79 million.
(2) Excludes covered foreclosed real estate totaling $121 million, $254 million, $378 million, $313 million and $160 million
at December 31, 2013, 2012, 2011, 2010 and 2009, respectively.
(3) Excludes mortgage loans guaranteed by GNMA that BB&T does not have the obligation to repurchase that are 90 days
or more past due totaling $511 million, $517 million, $426 million, $425 million and $337 million at December 31,
2013, 2012, 2011, 2010 and 2009, respectively.
(4) Excludes mortgage loans past due 90 days or more that are government guaranteed totaling $297 million, $254 million,
$206 million, $153 million and $8 million at December 31, 2013, 2012, 2011, 2010 and 2009, respectively. Includes past
due mortgage LHFS.
(5) Excludes covered loans past due 90 days or more totaling $304 million, $442 million, $736 million, $1.1 billion and $1.4
billion at December 31, 2013, 2012, 2011, 2010 and 2009, respectively.
(6) Excludes mortgage loans guaranteed by GNMA that BB&T does not have the obligation to repurchase that are past due
30-89 days totaling $4 million, $5 million, $7 million, $7 million and $10 million at December 31, 2013, 2012, 2011,
2010 and 2009, respectively.
(7) Excludes mortgage loans past due 30-89 days that are government guaranteed totaling $96 million, $96 million, $91
million, $83 million and $23 million at December 31, 2013, 2012, 2011, 2010 and 2009, respectively. Includes past due
mortgage LHFS.
(8) Excludes covered loans past due 30-89 days totaling $88 million, $135 million, $222 million, $363 million and $391
million at December 31, 2013, 2012, 2011, 2010 and 2009, respectively.