BB&T 2013 Annual Report Download - page 132
Download and view the complete annual report
Please find page 132 of the 2013 BB&T annual report below. You can navigate through the pages in the report by either clicking on the pages listed below, or by using the keyword search tool below to find specific information within the annual report.-
 1
1 -
2
-
3
-
4
-
5
-
6
-
7
-
8
-
9
-
10
-
11
-
12
-
13
-
14
-
15
-
16
-
17
-
18
-
19
-
20
-
21
-
22
-
23
-
24
-
25
-
26
-
27
-
28
-
29
-
30
-
31
-
32
-
33
-
34
-
35
-
36
-
37
-
38
-
39
-
40
-
41
-
42
-
43
-
44
-
45
-
46
-
47
-
48
-
49
-
50
-
51
-
52
-
53
-
54
-
55
-
56
-
57
-
58
-
59
-
60
-
61
-
62
-
63
-
64
-
65
-
66
-
67
-
68
-
69
-
70
-
71
-
72
-
73
-
74
-
75
-
76
-
77
-
78
-
79
-
80
-
81
-
82
-
83
-
84
-
85
-
86
-
87
-
88
-
89
-
90
-
91
-
92
-
93
-
94
-
95
-
96
-
97
-
98
-
99
-
100
-
101
-
102
-
103
-
104
-
105
-
106
-
107
-
108
-
109
-
110
-
111
-
112
-
113
-
114
-
115
-
116
-
117
-
118
-
119
-
120
-
121
-
 122
122 -
 123
123 -
 124
124 -
 125
125 -
 126
126 -
 127
127 -
 128
128 -
 129
129 -
 130
130 -
 131
131 -
 132
132 -
 133
133 -
 134
134 -
 135
135 -
 136
136 -
 137
137 -
 138
138 -
 139
139 -
 140
140 -
 141
141 -
 142
142 -
143
-
144
-
145
-
146
-
147
-
148
-
149
-
150
-
151
-
152
-
153
-
154
-
155
-
156
-
157
-
158
 |
 |

132
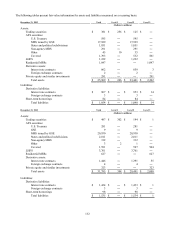
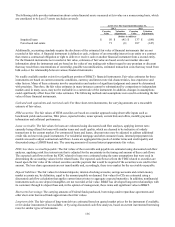
The following tables present fair value information for assets and liabilities measured on a recurring basis:
December 31, 2013 Total Level 1 Level 2 Level 3
(Dollars in millions)
Assets:
Trading securities $ 381 $ 256 $ 125 $ ―
AFS securities:
U.S. Treasury 595 ― 595 ―
MBS issued by GSE 17,929 ― 17,929 ―
States and political subdivisions 1,851 ― 1,851 ―
N
on-agency MBS 291 ― 291 ―
Other 45 10 35 ―
Covered 1,393 ― 532 861
LHFS 1,222 ― 1,222 ―
Residential MSRs 1,047 ― ― 1,047
Derivative assets:
Interest rate contracts 862 ― 859 3
Foreign exchange contracts 2 ― 2 ―
Private equity and similar investments 291 ― ― 291
Total assets $ 25,909 $ 266 $ 23,441 $ 2,202
Liabilities:
Derivative liabilities:
Interest rate contracts $ 967 $ ― $ 953 $ 14
Foreign exchange contracts 3 ― 3 ―
Short-term borrowings 84 ― 84 ―
Total liabilities $ 1,054 $ ― $ 1,040 $ 14
December 31, 2012 Total Level 1 Level 2 Level 3
(Dollars in millions)
Assets:
Trading securities $ 497 $ 302 $ 194 $ 1
AFS securities:
U.S. Treasury 281 ― 281 ―
GSE 9 ― 9 ―
MBS issued by GSE 20,930 ― 20,930 ―
States and political subdivisions 2,011 ― 2,011 ―
N
on-agency MBS 312 ― 312 ―
Other 3 2 1 ―
Covered 1,591 ― 597 994
LHFS 3,761 ― 3,761 ―
Residential MSRs 627 ― ― 627
Derivative assets:
Interest rate contracts 1,446 ― 1,391 55
Foreign exchange contracts 4 ― 4 ―
Private equity and similar investments 323 ― ― 323
Total assets $ 31,795 $ 304 $ 29,491 $ 2,000
Liabilities:
Derivative liabilities:
Interest rate contracts $ 1,434 $ ― $ 1,433 $ 1
Foreign exchange contracts 3 ― 3 ―
Short-term borrowings 98 ― 98 ―
Total liabilities $ 1,535 $ ― $ 1,534 $ 1