BB&T 2013 Annual Report Download - page 49
Download and view the complete annual report
Please find page 49 of the 2013 BB&T annual report below. You can navigate through the pages in the report by either clicking on the pages listed below, or by using the keyword search tool below to find specific information within the annual report.-
 1
1 -
2
-
3
-
4
-
5
-
6
-
7
-
8
-
9
-
10
-
11
-
12
-
13
-
14
-
15
-
16
-
17
-
18
-
19
-
20
-
21
-
22
-
23
-
24
-
25
-
26
-
27
-
28
-
29
-
30
-
31
-
32
-
33
-
34
-
35
-
36
-
37
-
38
-
 39
39 -
 40
40 -
 41
41 -
 42
42 -
 43
43 -
 44
44 -
 45
45 -
 46
46 -
 47
47 -
 48
48 -
 49
49 -
 50
50 -
 51
51 -
 52
52 -
 53
53 -
 54
54 -
 55
55 -
 56
56 -
 57
57 -
 58
58 -
 59
59 -
60
-
61
-
62
-
63
-
64
-
65
-
66
-
67
-
68
-
69
-
70
-
71
-
72
-
73
-
74
-
75
-
76
-
77
-
78
-
79
-
80
-
81
-
82
-
83
-
84
-
85
-
86
-
87
-
88
-
89
-
90
-
91
-
92
-
93
-
94
-
95
-
96
-
97
-
98
-
99
-
100
-
101
-
102
-
103
-
104
-
105
-
106
-
107
-
108
-
109
-
110
-
111
-
112
-
113
-
114
-
115
-
116
-
117
-
118
-
119
-
120
-
121
-
122
-
123
-
124
-
125
-
126
-
127
-
128
-
129
-
130
-
131
-
132
-
133
-
134
-
135
-
136
-
137
-
138
-
139
-
140
-
141
-
142
-
143
-
144
-
145
-
146
-
147
-
148
-
149
-
150
-
151
-
152
-
153
-
154
-
155
-
156
-
157
-
158
 |
 |

49
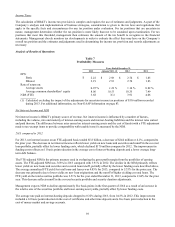
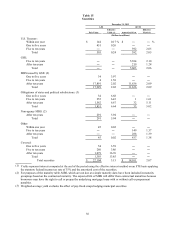
Regulatory charges decreased $53 million in 2012 due to improved credit quality, which led to lower deposit insurance
premiums.
Merger-related and restructuring charges increased $52 million compared to the prior year as a result of the Crump Insurance
and BankAtlantic acquisitions.
Other expense increased $62 million compared to 2011, primarily the result of higher advertising expenses, an increase in
depreciation expense related to assets under operating leases to customers driven by growth in BB&T’s equipment financing
business, higher operating charge-offs in 2012 and increased referral fee expense. The remaining noninterest expenses
increased a net $13 million, or 3.3%, compared to 2011.
Provision for Income Taxes
BB&T’s provision for income taxes totaled $1.4 billion, $764 million and $296 million for 2013, 2012 and 2011,
respectively. BB&T’s effective tax rates for the years ended 2013, 2012 and 2011 were 44.7%, 27.4% and 18.2%,
respectively. The increase in the effective tax rate for 2013 compared to 2012 was primarily due to the adjustments totaling
$516 million related to the previously described uncertain tax positions. Excluding the impact of these adjustments, the
effective tax rate for 2013 was 28.1%. The increase in the effective tax rate for 2012 compared to 2011 reflects a higher level
of pre-tax earnings relative to permanent income tax differences.
BB&T has extended credit to and invested in the obligations of states and municipalities and their agencies and has made
other investments and loans that produce tax-exempt income. The income generated from these investments, together with
certain other transactions that have favorable tax treatment, have reduced BB&T’s overall effective tax rate from the statutory
rate in all periods presented.
Management currently expects the effective tax rate in the first quarter of 2014 to be similar to the effective tax rate in the
fourth quarter of 2013, which was 29.2%.
Refer to Note 12 “Income Taxes” in the “Notes to Consolidated Financial Statements” for a reconciliation of the effective tax
rate to the statutory tax rate and a discussion of uncertain tax positions and other tax matters.
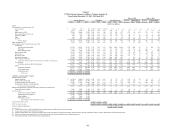
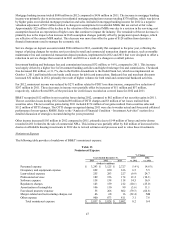
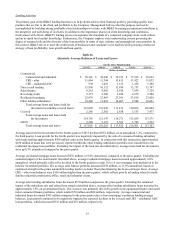
Segment Results
BB&T’s operations are divided into six reportable business segments. See Note 20 “Operating Segments” in the “Notes to
Consolidated Financial Statements” herein for additional disclosures related to BB&T’s operating segments, the internal
accounting and reporting practices used to manage these segments and financial disclosures for these segments.
Fluctuations in noninterest income and noninterest expense incurred directly by the segments are more fully discussed in the
“Noninterest Income” and “Noninterest Expense” sections above.
2013 compared to 2012
Community Banking
Community Banking had a network of 1,825 banking offices at the end of 2013, a decrease of seven offices compared to
December 31, 2012. The decrease in offices was driven by the closure of low volume branches, partially offset by de novo
branch openings. Community Banking net income was $982 million in 2013, an increase of $260 million, or 36.0%,
compared to 2012.
Segment net interest income totaled $3.2 billion in 2013, a decrease of $163 million, or 4.8%, compared to 2012. The
decrease in segment net interest income was primarily attributable to lower funding spreads earned on deposits, partially
offset by improvements in deposit mix as a result of growth in noninterest-bearing, money market and savings deposits, and a
decrease in certificates of deposits.
The allocated provision for loan and lease losses decreased $419 million, or 63.0%, reflecting improving mix due to the
runoff of lower quality loans.
Noninterest income of $1.2 billion increased $66 million, or 5.8%, primarily due to higher checkcard fees, bankcard fees,
merchant discounts, and service charges on deposits.