BB&T 2013 Annual Report Download - page 82
Download and view the complete annual report
Please find page 82 of the 2013 BB&T annual report below. You can navigate through the pages in the report by either clicking on the pages listed below, or by using the keyword search tool below to find specific information within the annual report.-
 1
1 -
2
-
3
-
4
-
5
-
6
-
7
-
8
-
9
-
10
-
11
-
12
-
13
-
14
-
15
-
16
-
17
-
18
-
19
-
20
-
21
-
22
-
23
-
24
-
25
-
26
-
27
-
28
-
29
-
30
-
31
-
32
-
33
-
34
-
35
-
36
-
37
-
38
-
39
-
40
-
41
-
42
-
43
-
44
-
45
-
46
-
47
-
48
-
49
-
50
-
51
-
52
-
53
-
54
-
55
-
56
-
57
-
58
-
59
-
60
-
61
-
62
-
63
-
64
-
65
-
66
-
67
-
68
-
69
-
70
-
71
-
 72
72 -
 73
73 -
 74
74 -
 75
75 -
 76
76 -
 77
77 -
 78
78 -
 79
79 -
 80
80 -
 81
81 -
 82
82 -
 83
83 -
 84
84 -
 85
85 -
 86
86 -
 87
87 -
 88
88 -
 89
89 -
 90
90 -
 91
91 -
 92
92 -
93
-
94
-
95
-
96
-
97
-
98
-
99
-
100
-
101
-
102
-
103
-
104
-
105
-
106
-
107
-
108
-
109
-
110
-
111
-
112
-
113
-
114
-
115
-
116
-
117
-
118
-
119
-
120
-
121
-
122
-
123
-
124
-
125
-
126
-
127
-
128
-
129
-
130
-
131
-
132
-
133
-
134
-
135
-
136
-
137
-
138
-
139
-
140
-
141
-
142
-
143
-
144
-
145
-
146
-
147
-
148
-
149
-
150
-
151
-
152
-
153
-
154
-
155
-
156
-
157
-
158
 |
 |

82
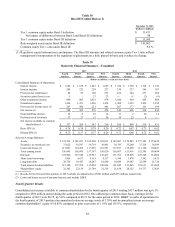
Table 38
Basel III Capital Ratios (1)
December 31, 2013
(Dollars in millions)
Tier 1 common equity under Basel I definition $ 13,471
N
et impact of differences between Basel I and Basel III definitions 98
Tier 1 common equity under Basel III definition $ 13,569
Risk-weighted assets under Basel III definition $ 141,962
Common equity Tier 1 ratio under Basel III 9.6 %
(1) Regulatory capital information is preliminary. The Basel III amounts and related common equity Tier 1 ratio reflects
management's interpretation of the regulatory requirements on a fully phased-in basis and is subject to change.
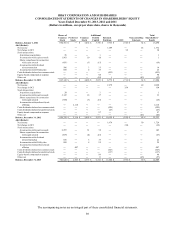
Table 39
Quarterly Financial Summary―Unaudited
2013 2012
Fourth Third Second First Fourth Third Second First
Quarter Quarter Quarter Quarter Quarter Quarter Quarter Quarter
(Dollars in millions, except per share data)
Consolidated Summary of Operations:
Interest income $ 1,566 $ 1,639 $ 1,643 $ 1,659 $ 1,726 $ 1,720 $ 1,728 $ 1,743
Interest expense 204 222 228 237 250 237 266 307
Provision for credit losses 60 92 168 272 252 244 273 288
Securities gains (losses), net 5 - 23 23 ― (1) (2) (9)
Other noninterest income 980 905 1,023 978 1,020 964 968 880
N
oninterest expense 1,456 1,471 1,496 1,414 1,488 1,529 1,426 1,385
Provision for income taxes (1) 243 450 221 481 207 177 191 189
N
et income (1) 588 309 576 256 549 496 538 445
N
oncontrolling interest 14 4 16 16 13 2 20 14
Preferred stock dividends 37 37 13 30 30 25 8 ―
N
et income available to common
shareholders (1) $ 537 $ 268 $ 547 $ 210 $ 506 $ 469 $ 510 $ 431
Basic EPS (1) $ 0.76 $ 0.38 $ 0.78 $ 0.30 $ 0.72 $ 0.67 $ 0.73 $ 0.62
Diluted EPS (1) $ 0.75 $ 0.37 $ 0.77 $ 0.29 $ 0.71 $ 0.66 $ 0.72 $ 0.61
Selected Average Balances:
Assets $ 179,534 $ 181,021 $ 182,508 $ 182,013 $ 182,807 $ 179,845 $ 177,383 $ 174,439
Securities, at amortized cost 37,022 36,547 36,719 36,801 36,383 35,260 37,114 36,589
Loans and leases (2) 117,001 118,265 117,852 116,981 117,103 115,609 111,760 110,403
Total earning assets 156,045 156,985 157,197 156,620 156,863 153,918 152,385 150,494
Deposits 125,906 127,948 129,983 130,437 131,762 128,695 125,348 124,606
Short-term borrowings 3,865 4,637 5,118 4,217 3,340 3,478 3,362 3,452
Long-term debt 20,756 19,447 18,287 18,690 18,689 19,682 22,544 21,720
Total interest-bearing liabilities 115,180 117,788 119,802 120,826 121,942 121,865 123,611 123,605
Shareholders' equity 22,305 22,139 21,789 21,315 21,188 20,125 18,737 17,829
(1) Results for the first and third quarters of 2013 include tax adjustments of $281 million and $235 million, respectively.
(2) Loans and leases are net of unearned income and include LHFS.
Fourth Quarter Results
Consolidated net income available to common shareholders for the fourth quarter of 2013 totaling $537 million was up 6.1%
compared to $506 million earned during the same period in 2012. On a diluted per common share basis, earnings for the
fourth quarter of 2013 were $0.75, up 5.6% compared to $0.71 for the same period in 2012. BB&T’s results of operations for
the fourth quarter of 2013 produced an annualized return on average assets of 1.30% and an annualized return on average
common shareholders’ equity of 10.85% compared to prior year ratios of 1.19% and 10.51%, respectively.