BB&T 2013 Annual Report Download - page 59
Download and view the complete annual report
Please find page 59 of the 2013 BB&T annual report below. You can navigate through the pages in the report by either clicking on the pages listed below, or by using the keyword search tool below to find specific information within the annual report.-
 1
1 -
2
-
3
-
4
-
5
-
6
-
7
-
8
-
9
-
10
-
11
-
12
-
13
-
14
-
15
-
16
-
17
-
18
-
19
-
20
-
21
-
22
-
23
-
24
-
25
-
26
-
27
-
28
-
29
-
30
-
31
-
32
-
33
-
34
-
35
-
36
-
37
-
38
-
39
-
40
-
41
-
42
-
43
-
44
-
45
-
46
-
47
-
48
-
 49
49 -
 50
50 -
 51
51 -
 52
52 -
 53
53 -
 54
54 -
 55
55 -
 56
56 -
 57
57 -
 58
58 -
 59
59 -
 60
60 -
 61
61 -
 62
62 -
 63
63 -
 64
64 -
 65
65 -
 66
66 -
 67
67 -
 68
68 -
 69
69 -
70
-
71
-
72
-
73
-
74
-
75
-
76
-
77
-
78
-
79
-
80
-
81
-
82
-
83
-
84
-
85
-
86
-
87
-
88
-
89
-
90
-
91
-
92
-
93
-
94
-
95
-
96
-
97
-
98
-
99
-
100
-
101
-
102
-
103
-
104
-
105
-
106
-
107
-
108
-
109
-
110
-
111
-
112
-
113
-
114
-
115
-
116
-
117
-
118
-
119
-
120
-
121
-
122
-
123
-
124
-
125
-
126
-
127
-
128
-
129
-
130
-
131
-
132
-
133
-
134
-
135
-
136
-
137
-
138
-
139
-
140
-
141
-
142
-
143
-
144
-
145
-
146
-
147
-
148
-
149
-
150
-
151
-
152
-
153
-
154
-
155
-
156
-
157
-
158
 |
 |

59
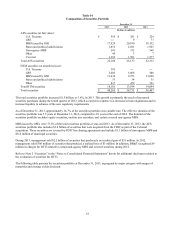
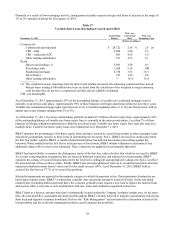
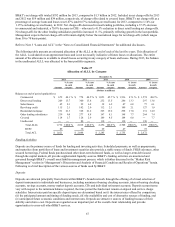
The following table presents BB&T’s total loan portfolio based upon BB&T’s LOBs:
Table 18
Composition of Loan and Lease Portfolio Based on LOB
December 31,
2013 2012 2011 2010 2009
(Dollars in millions)
Commercial $ 51,118 $ 51,017 $ 49,165 $ 48,886 $ 49,820
Direct retail lending 15,869 15,817 14,506 13,807 14,406
Sales finance 9,382 7,736 7,401 7,050 6,290
Revolving credit 2,403 2,330 2,212 2,127 2,016
Residential mortgage 24,648 24,272 20,581 17,550 15,435
Other lending subsidiaries 10,462 10,137 8,737 7,953 7,670
Total loans and leases held for investment
(excluding covered loans) 113,882 111,309 102,602 97,373 95,637
Covered 2,035 3,294 4,867 6,194 8,019
Total loans and leases held for investment 115,917 114,603 107,469 103,567 103,656
LHFS 1,222 3,761 3,736 3,697 2,551
Total loans and leases $ 117,139 $ 118,364 $ 111,205 $ 107,264 $ 106,207
Total loans and leases were $117.1 billion at year-end 2013, a decrease of $1.2 billion, or 1.0%, compared to the balance at
year-end 2012. This decrease was largely attributable to a $2.5 billion decline in LHFS compared to year-end 2012. This
decline reflects a lower level of loan origination activity in the latter part of 2013 and management’s decision in the fourth
quarter of 2013 to retain certain 10 to 15 year residential mortgage loan production in the held for investment portfolio. Total
loans and leases held for investment, excluding covered loans, increased $2.6 billion in 2013, based on broad-based growth in
the portfolio. The covered loan portfolio, which totaled $2.0 billion at year-end 2013, continued to runoff during the year,
resulting in a decline of $1.3 billion compared to the prior year-end.
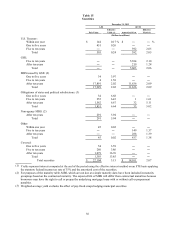
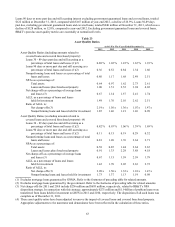
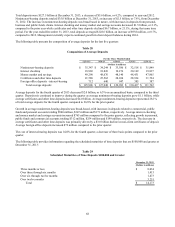
The following tables summarize the loan portfolio based on regulatory classifications, which focuses on the underlying loan
collateral, and differs from internal classifications presented herein that focus on the primary purpose of the loan. Covered
loans are included in their respective categories.
Table 19
Composition of Loan and Lease Portfolio
December 31,
2013 2012 2011 2010 2009
(Dollars in millions)
Commercial, financial and agricultural $ 25,260 $ 23,863 $ 21,452 $ 20,490 $ 19,076
Lease receivables 1,126 1,114 1,067 1,158 1,092
Real estate-construction and land development 4,630 5,900 7,714 10,969 15,353
Real estate-mortgage 65,485 65,760 60,821 57,418 55,671
Consumer 19,416 17,966 16,415 13,532 12,464
Total loans and leases held for investment 115,917 114,603 107,469 103,567 103,656
LHFS 1,222 3,761 3,736 3,697 2,551
Total loans and leases $ 117,139 $ 118,364 $ 111,205 $ 107,264 $ 106,207