BB&T 2013 Annual Report Download - page 33
Download and view the complete annual report
Please find page 33 of the 2013 BB&T annual report below. You can navigate through the pages in the report by either clicking on the pages listed below, or by using the keyword search tool below to find specific information within the annual report.-
 1
1 -
2
-
3
-
4
-
5
-
6
-
7
-
8
-
9
-
10
-
11
-
12
-
13
-
14
-
15
-
16
-
17
-
18
-
19
-
20
-
21
-
22
-
 23
23 -
 24
24 -
 25
25 -
 26
26 -
 27
27 -
 28
28 -
 29
29 -
 30
30 -
 31
31 -
 32
32 -
 33
33 -
 34
34 -
 35
35 -
 36
36 -
 37
37 -
 38
38 -
 39
39 -
 40
40 -
 41
41 -
 42
42 -
 43
43 -
44
-
45
-
46
-
47
-
48
-
49
-
50
-
51
-
52
-
53
-
54
-
55
-
56
-
57
-
58
-
59
-
60
-
61
-
62
-
63
-
64
-
65
-
66
-
67
-
68
-
69
-
70
-
71
-
72
-
73
-
74
-
75
-
76
-
77
-
78
-
79
-
80
-
81
-
82
-
83
-
84
-
85
-
86
-
87
-
88
-
89
-
90
-
91
-
92
-
93
-
94
-
95
-
96
-
97
-
98
-
99
-
100
-
101
-
102
-
103
-
104
-
105
-
106
-
107
-
108
-
109
-
110
-
111
-
112
-
113
-
114
-
115
-
116
-
117
-
118
-
119
-
120
-
121
-
122
-
123
-
124
-
125
-
126
-
127
-
128
-
129
-
130
-
131
-
132
-
133
-
134
-
135
-
136
-
137
-
138
-
139
-
140
-
141
-
142
-
143
-
144
-
145
-
146
-
147
-
148
-
149
-
150
-
151
-
152
-
153
-
154
-
155
-
156
-
157
-
158
 |
 |

33
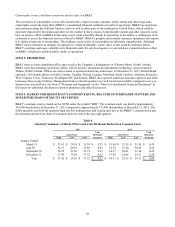
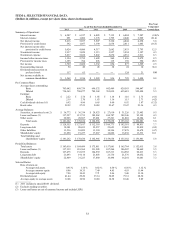
ITEM 6. SELECTED FINANCIAL DATA
(Dollars in millions, except per share data, shares in thousands)
Five Year
As of/ For the Years Ended December 31, Compound
2013 2012 2011 2010 2009 2008 Growth Rate
Summary of Operations:
Interest income $ 6,507 $ 6,917 $ 6,885 $ 7,115 $ 6,884 $ 7,207 (2.0)%
Interest expense 891 1,060 1,378 1,795 2,040 2,969 (21.4)
N
et interest income 5,616 5,857 5,507 5,320 4,844 4,238 5.8
Provision for credit losses 592 1,057 1,190 2,638 2,811 1,445 (16.3)
N
et interest income afte
r
provision for credit losses 5,024 4,800 4,317 2,682 2,033 2,793 12.5
N
oninterest income 3,937 3,820 3,113 3,957 3,934 3,197 4.3
N
oninterest expense 5,837 5,828 5,802 5,670 4,931 3,911 8.3
Income before income taxes 3,124 2,792 1,628 969 1,036 2,079 8.5
Provision for income taxes 1,395 764 296 115 159 550 20.5
N
et income 1,729 2,028 1,332 854 877 1,529 2.5
N
oncontrolling interest 50 49 43 38 24 10 38.0
Dividends and accretion on
preferred stock 117 63 ― ― 124 21 NM
N
et income available to
common shareholders $ 1,562 $ 1,916 $ 1,289 $ 816 $ 729 $ 1,498 0.8
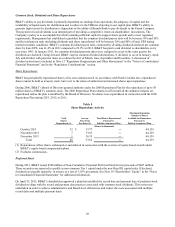
Per Common Share:
Average shares outstanding:
Basic 703,042 698,739 696,532 692,489 629,583 548,847 5.1
Diluted 714,363 708,877 705,168 701,039 635,619 552,498 5.3
Earnings:
Basic $ 2.22 $ 2.74 $ 1.85 $ 1.18 $ 1.16 $ 2.73 (4.1)
Diluted 2.19 2.70 1.83 1.16 1.15 2.71 (4.2)
Cash dividends declared (1) 0.92 0.80 0.65 0.60 0.92 1.87 (13.2)
Book value 28.52 27.21 24.98 23.67 23.47 23.16 4.3
Average Balances:
Securities, at amortized cost (2) $ 36,772 $ 36,334 $ 29,923 $ 27,610 $ 31,226 $ 23,402 9.5
Loans and leases (3) 117,527 113,733 105,962 104,787 102,146 95,195 4.3
Other assets 26,963 28,567 27,081 27,261 21,810 18,284 8.1
Total assets $ 181,262 $ 178,634 $ 162,966 $ 159,658 $ 155,182 $ 136,881 5.8
Deposits $ 128,555 $ 127,617 $ 112,318 $ 106,773 $ 102,381 $ 88,831 7.7
Long-term debt 19,301 20,651 22,257 21,653 19,085 19,839 (0.5)
Other liabilities 11,516 10,889 11,124 14,346 17,478 14,678 (4.7)
Shareholders' equity 21,890 19,477 17,267 16,886 16,238 13,533 10.1
Total liabilities and
shareholders' equity $ 181,262 $ 178,634 $ 162,966 $ 159,658 $ 155,182 $ 136,881 5.8
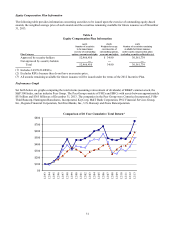
Period-End Balances:
Total assets $ 183,010 $ 184,499 $ 175,011 $ 157,081 $ 165,764 $ 152,015 3.8
Loans and leases (3) 117,139 118,364 111,205 107,264 106,207 98,669 3.5
Deposits 127,475 133,075 124,939 107,213 114,965 98,613 5.3
Long-term debt 21,493 19,114 21,803 21,730 21,376 18,032 3.6
Shareholders' equity 22,809 21,223 17,480 16,498 16,241 16,081 7.2
Selected Ratios:
Rate of return on:
Average total assets 0.95 % 1.14 % 0.82 % 0.54 % 0.56 % 1.12 %
Average common equity 8.06 10.35 7.49 4.85 4.93 11.44
Average total equity 7.90 10.41 7.71 5.06 5.40 11.30
Dividend payout 41.44 29.20 35.14 50.85 79.31 68.50
Average equity to average assets 12.08 10.90 10.60 10.58 10.46 9.89
(1) 2011 included a special $0.01 dividend.
(2) Excludes trading securities.
(3) Loans and leases are net of unearned income and include LHFS.