BB&T 2013 Annual Report Download - page 81
Download and view the complete annual report
Please find page 81 of the 2013 BB&T annual report below. You can navigate through the pages in the report by either clicking on the pages listed below, or by using the keyword search tool below to find specific information within the annual report.-
 1
1 -
2
-
3
-
4
-
5
-
6
-
7
-
8
-
9
-
10
-
11
-
12
-
13
-
14
-
15
-
16
-
17
-
18
-
19
-
20
-
21
-
22
-
23
-
24
-
25
-
26
-
27
-
28
-
29
-
30
-
31
-
32
-
33
-
34
-
35
-
36
-
37
-
38
-
39
-
40
-
41
-
42
-
43
-
44
-
45
-
46
-
47
-
48
-
49
-
50
-
51
-
52
-
53
-
54
-
55
-
56
-
57
-
58
-
59
-
60
-
61
-
62
-
63
-
64
-
65
-
66
-
67
-
68
-
69
-
70
-
 71
71 -
 72
72 -
 73
73 -
 74
74 -
 75
75 -
 76
76 -
 77
77 -
 78
78 -
 79
79 -
 80
80 -
 81
81 -
 82
82 -
 83
83 -
 84
84 -
 85
85 -
 86
86 -
 87
87 -
 88
88 -
 89
89 -
 90
90 -
 91
91 -
92
-
93
-
94
-
95
-
96
-
97
-
98
-
99
-
100
-
101
-
102
-
103
-
104
-
105
-
106
-
107
-
108
-
109
-
110
-
111
-
112
-
113
-
114
-
115
-
116
-
117
-
118
-
119
-
120
-
121
-
122
-
123
-
124
-
125
-
126
-
127
-
128
-
129
-
130
-
131
-
132
-
133
-
134
-
135
-
136
-
137
-
138
-
139
-
140
-
141
-
142
-
143
-
144
-
145
-
146
-
147
-
148
-
149
-
150
-
151
-
152
-
153
-
154
-
155
-
156
-
157
-
158
 |
 |

81
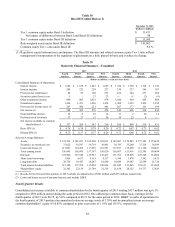
BB&T regularly performs stress testing on its capital levels and is required to periodically submit the company’s capital plans
to the banking regulators. Management’s capital deployment plan in order of preference is to focus on organic growth,
dividends, strategic opportunities and share repurchases.
Table 37
Capital Ratios
December 31,
2013 2012
(Dollars in millions)
Risk-based:
Tier 1 (1) 11.8 % 10.5 %
Total (1) 14.3 13.4
Leverage capital 9.3 8.2
N
on-GAAP capital measures (2)
Tangible common equity as a percentage of tangible assets 7.3 % 6.5 %
Tier 1 common equity as a percentage of risk-weighted assets (1) 9.9 9.0
Tangible common equity (book value) per common share (3) $ 18.08 $ 16.53
Calculations of tangible common equity, Tier 1 common equity and tangible assets (2):
Total shareholders' equity $ 22,809 $ 21,223
Less:
Preferred stock 2,603 2,116
N
oncontrolling interests 50 65
Intangible assets 7,383 7,477
Tangible common equity 12,773 11,565
Add:
Regulatory adjustments 698 692
Tier 1 common equity (Basel I) $ 13,471 $ 12,257
Total assets $ 183,010 $ 184,499
Less:
Intangible assets 7,383 7,477
Tangible assets (3) $ 175,627 $ 177,022
Total risk-weighted assets (1) $ 136,489 $ 136,367
Common shares outstanding at end of period (in thousands) 706,620 699,728
(1) Tier 1 capital, total capital and Tier 1 common equity ratios as of December 31, 2012 were previously reported on
BB&T’s December 31, 2012 Form 10-K as 11.0%, 13.9% and 9.3%, respectively. Risk-weighted assets as of December
31, 2012 was previously reported on BB&T’s December 31, 2012 Form 10-K as $131.1 billion.
(2) Tangible common equity, Tier 1 common equity and related ratios are non-GAAP measures. Management uses these
measures to assess the quality of capital and believes that investors may find them useful in their analysis of the
Company. These capital measures are not necessarily comparable to similar capital measures that may be presented by
other companies.
(3) During 2013, the calculation of tangible book value per common share was revised to be based on tangible common
equity whereas this calculation was previously based upon Tier 1 common equity. In addition, the calculation of tangible
assets was revised to no longer include deferred taxes on intangible assets. Previously presented information has been
revised to conform to the current presentation.
BB&T’s estimated common equity Tier 1 ratio under Basel III, on a fully phased-in basis, was approximately 9.6% at
December 31, 2013 based on management’s interpretation of the final rules adopted by the FRB on July 2, 2013, which
established a new comprehensive capital framework for U.S. banking organizations. The minimum required common equity
Tier 1 ratio, including the capital conservation buffer, will gradually increase from 4.5% on January 1, 2015 to 7.0% on
January 1, 2019. The following table presents the calculation of the Tier 1 common equity ratio under the U.S. Basel III
guidelines: