BB&T 2013 Annual Report Download - page 110
Download and view the complete annual report
Please find page 110 of the 2013 BB&T annual report below. You can navigate through the pages in the report by either clicking on the pages listed below, or by using the keyword search tool below to find specific information within the annual report.-
 1
1 -
2
-
3
-
4
-
5
-
6
-
7
-
8
-
9
-
10
-
11
-
12
-
13
-
14
-
15
-
16
-
17
-
18
-
19
-
20
-
21
-
22
-
23
-
24
-
25
-
26
-
27
-
28
-
29
-
30
-
31
-
32
-
33
-
34
-
35
-
36
-
37
-
38
-
39
-
40
-
41
-
42
-
43
-
44
-
45
-
46
-
47
-
48
-
49
-
50
-
51
-
52
-
53
-
54
-
55
-
56
-
57
-
58
-
59
-
60
-
61
-
62
-
63
-
64
-
65
-
66
-
67
-
68
-
69
-
70
-
71
-
72
-
73
-
74
-
75
-
76
-
77
-
78
-
79
-
80
-
81
-
82
-
83
-
84
-
85
-
86
-
87
-
88
-
89
-
90
-
91
-
92
-
93
-
94
-
95
-
96
-
97
-
98
-
99
-
 100
100 -
 101
101 -
 102
102 -
 103
103 -
 104
104 -
 105
105 -
 106
106 -
 107
107 -
 108
108 -
 109
109 -
 110
110 -
 111
111 -
 112
112 -
 113
113 -
 114
114 -
 115
115 -
 116
116 -
 117
117 -
 118
118 -
 119
119 -
 120
120 -
121
-
122
-
123
-
124
-
125
-
126
-
127
-
128
-
129
-
130
-
131
-
132
-
133
-
134
-
135
-
136
-
137
-
138
-
139
-
140
-
141
-
142
-
143
-
144
-
145
-
146
-
147
-
148
-
149
-
150
-
151
-
152
-
153
-
154
-
155
-
156
-
157
-
158
 |
 |

110
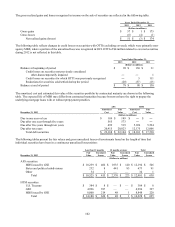
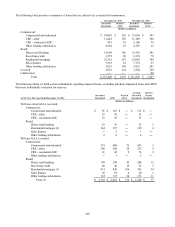
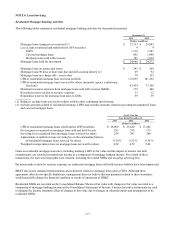
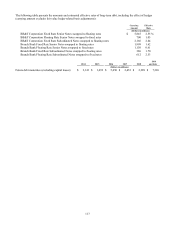
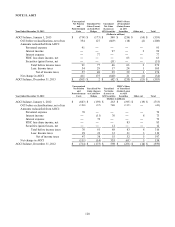
The following table summarizes the primary reason loan modification were classified as TDRs and includes newly
designated TDRs as well as modifications made to existing TDRs. Balances represent the recorded investment at the end of
the quarter in which the modification was made. Rate modifications include TDRs made with below market interest rates that
also include modifications of loan structures.
Years Ended December 31,
2013 2012 2011
Type of Type of Type of
Modification ALLL Modification ALLL Modification ALLL
Rate Structure Impact Rate Structure Impact Rate Structure Impact
(Dollars in millions)
Commercial:
Commercial and industrial $ 99 $ 27 $ 3 $ 51 $ 63 $ ― $ 29 $ 68 $ 5
CRE - other 62 54 1 67 45 ― 56 58 8
CRE - residential ADC 22 10 (2) 44 34 (1) 29 47 10
Other lending subsidiaries ― ― ― ― ― ― 1 1 ―
Retail:
Direct retail lending 45 9 7 120 17 35 51 5 9
Revolving credit 26 ― 4 30 ― 5 40 ― 8
Residential mortgage 103 68 11 241 88 22 142 35 17
Sales finance 4 7 3 16 ― 4 5 5 1
Other lending subsidiaries 167 ― 34 123 2 35 37 7 15
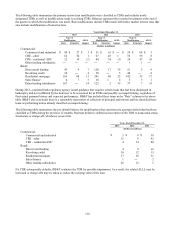
During 2012, a national bank regulatory agency issued guidance that requires certain loans that had been discharged in
bankruptcy and not reaffirmed by the borrower to be accounted for as TDRs and possibly as nonperforming, regardless of
their actual payment history and expected performance. BB&T has included these loans in the “Rate” column in the above
table. BB&T also concluded there is a reasonable expectation of collection of principal and interest and has classified these
loans as performing unless already classified as nonperforming.
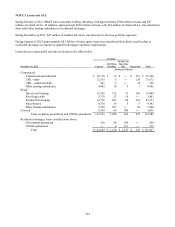
The following table summarizes the pre-default balance for modifications that experienced a payment default that had been
classified as TDRs during the previous 12 months. Payment default is defined as movement of the TDR to nonaccrual status,
foreclosure or charge-off, whichever occurs first.
Years Ended December 31,
2013 2012 2011
(Dollars in millions)
Commercial:
Commercial and industrial $ 5 $ 8 $ 39
CRE - other 11 6 92
CRE - residential ADC 4 14 80
Retail:
Direct retail lending 4 8 16
Revolving credit 10 12 15
Residential mortgage 17 36 31
Sales finance 1 ― 2
Other lending subsidiaries 26 12 5
If a TDR subsequently defaults, BB&T evaluates the TDR for possible impairment. As a result, the related ALLL may be
increased or charge-offs may be taken to reduce the carrying value of the loan.