BB&T 2013 Annual Report Download - page 114
Download and view the complete annual report
Please find page 114 of the 2013 BB&T annual report below. You can navigate through the pages in the report by either clicking on the pages listed below, or by using the keyword search tool below to find specific information within the annual report.-
 1
1 -
2
-
3
-
4
-
5
-
6
-
7
-
8
-
9
-
10
-
11
-
12
-
13
-
14
-
15
-
16
-
17
-
18
-
19
-
20
-
21
-
22
-
23
-
24
-
25
-
26
-
27
-
28
-
29
-
30
-
31
-
32
-
33
-
34
-
35
-
36
-
37
-
38
-
39
-
40
-
41
-
42
-
43
-
44
-
45
-
46
-
47
-
48
-
49
-
50
-
51
-
52
-
53
-
54
-
55
-
56
-
57
-
58
-
59
-
60
-
61
-
62
-
63
-
64
-
65
-
66
-
67
-
68
-
69
-
70
-
71
-
72
-
73
-
74
-
75
-
76
-
77
-
78
-
79
-
80
-
81
-
82
-
83
-
84
-
85
-
86
-
87
-
88
-
89
-
90
-
91
-
92
-
93
-
94
-
95
-
96
-
97
-
98
-
99
-
100
-
101
-
102
-
103
-
 104
104 -
 105
105 -
 106
106 -
 107
107 -
 108
108 -
 109
109 -
 110
110 -
 111
111 -
 112
112 -
 113
113 -
 114
114 -
 115
115 -
 116
116 -
 117
117 -
 118
118 -
 119
119 -
 120
120 -
 121
121 -
 122
122 -
 123
123 -
 124
124 -
125
-
126
-
127
-
128
-
129
-
130
-
131
-
132
-
133
-
134
-
135
-
136
-
137
-
138
-
139
-
140
-
141
-
142
-
143
-
144
-
145
-
146
-
147
-
148
-
149
-
150
-
151
-
152
-
153
-
154
-
155
-
156
-
157
-
158
 |
 |

114
Years Ended December 31,
2013 2012 2011
(Dollars in millions)
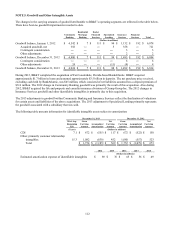
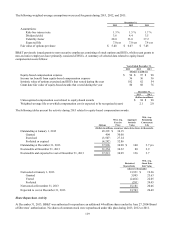
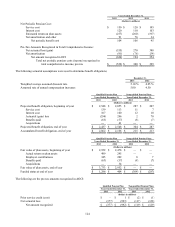
Carrying value, January 1, $ 627 $ 563 $ 830
Additions 336 270 225
Change in fair value due to changes in valuation inputs or assumptions:
Prepayment speeds 287 19 (284)
Weighted average OAS (31) (36) (20)
Servicing costs (29) (22) (30)
Realization of expected net servicing cash flows, passage of time and other (143) (167) (158)
Carrying value, December 31, $ 1,047 $ 627 $ 563
Gains (losses) on derivative financial instruments used to mitigate the
income statement effect of changes in fair value $ (197) $ 128 $ 394
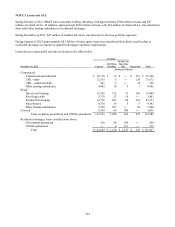
During 2013, the prepayment speed assumptions were updated as actual observed prepayment speeds were slower, primarily
as a result of rising interest rates. These valuation increases were partially offset by realization of servicing cash flows as well
as higher servicing costs due to regulatory requirements and updates to OAS due to market changes in required rates of
return.
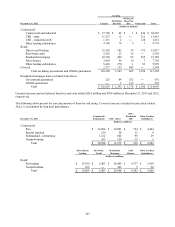
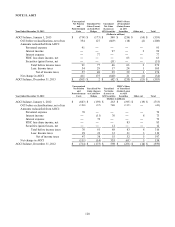
The sensitivity of the fair value of the residential MSRs to adverse changes in key economic assumptions is included in the
accompanying table:
December 31, 2013 December 31, 2012
Range Weighted Range Weighted
Min Max Average Min Max Average
(Dollars in millions)
Prepayment speed 5.5 % 8.0 % 6.9 % 15.3 % 18.5 % 17.3 %
Effect on fair value of a 10% increase $ (33) $ (35)
Effect on fair value of a 20% increase (64) (67)
OAS 9.1 % 9.9 % 9.3 % 8.2 % 8.4 % 8.3 %
Effect on fair value of a 10% increase $ (39) $ (17)
Effect on fair value of a 20% increase (75) (33)
Composition of loans serviced for others:
Fixed-rate residential mortgage loans 99.7 % 99.4 %
Adjustable-rate residential mortgage loans 0.3 0.6
Total 100.0 % 100.0 %
Weighted average life 7.9 yrs 4.4 yrs
The sensitivity calculations above are hypothetical and should not be considered to be predictive of future performance. As
indicated, changes in fair value based on adverse changes in assumptions generally cannot be extrapolated because the
relationship of the change in assumption to the change in fair value may not be linear. Also, in the above table, the effect of
an adverse variation in a particular assumption on the fair value of the MSRs is calculated without changing any other
assumption; while in reality, changes in one factor may result in changes in another, which may magnify or counteract the
effect of the change.