BB&T 2013 Annual Report Download - page 50
Download and view the complete annual report
Please find page 50 of the 2013 BB&T annual report below. You can navigate through the pages in the report by either clicking on the pages listed below, or by using the keyword search tool below to find specific information within the annual report.-
 1
1 -
2
-
3
-
4
-
5
-
6
-
7
-
8
-
9
-
10
-
11
-
12
-
13
-
14
-
15
-
16
-
17
-
18
-
19
-
20
-
21
-
22
-
23
-
24
-
25
-
26
-
27
-
28
-
29
-
30
-
31
-
32
-
33
-
34
-
35
-
36
-
37
-
38
-
39
-
 40
40 -
 41
41 -
 42
42 -
 43
43 -
 44
44 -
 45
45 -
 46
46 -
 47
47 -
 48
48 -
 49
49 -
 50
50 -
 51
51 -
 52
52 -
 53
53 -
 54
54 -
 55
55 -
 56
56 -
 57
57 -
 58
58 -
 59
59 -
 60
60 -
61
-
62
-
63
-
64
-
65
-
66
-
67
-
68
-
69
-
70
-
71
-
72
-
73
-
74
-
75
-
76
-
77
-
78
-
79
-
80
-
81
-
82
-
83
-
84
-
85
-
86
-
87
-
88
-
89
-
90
-
91
-
92
-
93
-
94
-
95
-
96
-
97
-
98
-
99
-
100
-
101
-
102
-
103
-
104
-
105
-
106
-
107
-
108
-
109
-
110
-
111
-
112
-
113
-
114
-
115
-
116
-
117
-
118
-
119
-
120
-
121
-
122
-
123
-
124
-
125
-
126
-
127
-
128
-
129
-
130
-
131
-
132
-
133
-
134
-
135
-
136
-
137
-
138
-
139
-
140
-
141
-
142
-
143
-
144
-
145
-
146
-
147
-
148
-
149
-
150
-
151
-
152
-
153
-
154
-
155
-
156
-
157
-
158
 |
 |

50
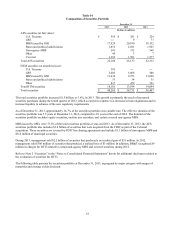
Noninterest expense of $1.7 billion decreased $126 million, or 6.9%, primarily driven by lower foreclosed property,
regulatory, and professional services expense.
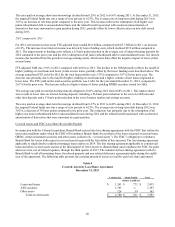
In December 2013, BB&T announced the signing of an agreement to acquire 21 branches in Texas from Citibank, which
includes $1.2 billion in deposits and $134 million in loans.
Residential Mortgage Banking
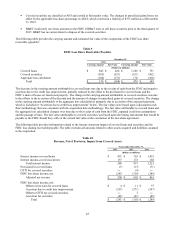
Mortgage originations totaled $31.6 billion in 2013, a decrease of $1.5 billion, or 4.5%, compared to $33.1 billion in 2012.
BB&T’s residential mortgage servicing portfolio, which includes both retained loans and loans serviced for third parties,
totaled $112.8 billion at the end of 2013, an increase of 11.3%, compared to $101.4 billion at December 31, 2012. Residential
Mortgage Banking net income was $284 million in 2013, a decrease of $83 million, or 22.6%, compared to 2012.
Segment net interest income increased $44 million, or 11.7%, to $421 million. The increase in segment net interest income
was driven by growth in loans held for investment, which was partially attributable to the decision to begin retaining certain
originated mortgage loans, and higher credit spreads to funding costs for both LHFS and loans held for investment.
The allocated provision for loan and lease losses decreased $61 million, primarily reflecting an improvement in mix due to
the runoff of lower quality loans. Net charge-offs of $78 million were recorded in 2013, compared to $133 million in 2012, as
nonaccrual and aged loans (excluding guaranteed loans) decreased during the period.
Noninterest income decreased $270 million, primarily driven by lower gain on sale margins, which reflects increased
competition and a higher proportion of loans originated through the correspondent network, and a decrease in net MSR
valuation adjustments.
Noninterest expense decreased $45 million primarily due to lower pre-foreclosure and foreclosed property expense and lower
expense associated with mortgage repurchase reserves.
Dealer Financial Services
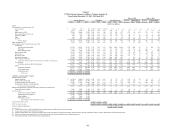
Dealer Financial Services net income was $203 million in 2013, a decrease of $15 million, or 6.9%, compared to 2012.
Segment net interest income increased $27 million, primarily the result of loan growth and wider credit spreads in the
Regional Acceptance Corporation portfolio. Dealer Financial Services average loans grew by $840 million, or 8.5%,
compared to 2012.
The allocated provision for loan and lease losses increased $50 million, primarily due to a more normalized volume of
charge-offs in the Regional Acceptance Corporation portfolio after experiencing a lower charge-off volume in recent years.
Specialized Lending
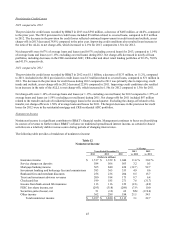
Specialized Lending net income was $275 million in 2013, an increase of $31 million, or 12.7%, compared to 2012.
Segment net interest income decreased $10 million, or 1.8%, compared to 2012. During the fourth quarter, BB&T sold a
consumer lending subsidiary that focused its business on the subprime consumer market. The sale of this subsidiary included
loans totaling approximately $500 million. In connection with this sale transaction, loans totaling approximately $230 million
were transferred to Residential Mortgage Banking. Excluding this sales transaction, Specialized Lending grew average
balances by $925 million, or 6.7%, over 2012. This increase was primarily driven by 32.3% growth in average small ticket
consumer finance loan balances, 7.6% growth in the average commercial insurance premium financing portfolio, and a 7.0%
increase in the average commercial finance portfolio.
The allocated provision for loan and lease losses decreased $50 million, which primarily reflects the removal of reserves in
connection with the sale of $500 million of consumer lending loans and the transfer of $230 million of consumer lending
loans to Residential Mortgage Banking. Due to the overall higher credit risk profiles of Specialized Lending’s clients, loss
rates are expected to be higher than conventional bank lending. Loss rates are also affected by shifts in the portfolio mix of
the underlying subsidiaries.
Insurance Services
Insurance Services net income was $167 million in 2013, an increase of $24 million, or 16.8%, compared to 2012.