BB&T 2013 Annual Report Download - page 58
Download and view the complete annual report
Please find page 58 of the 2013 BB&T annual report below. You can navigate through the pages in the report by either clicking on the pages listed below, or by using the keyword search tool below to find specific information within the annual report.-
 1
1 -
2
-
3
-
4
-
5
-
6
-
7
-
8
-
9
-
10
-
11
-
12
-
13
-
14
-
15
-
16
-
17
-
18
-
19
-
20
-
21
-
22
-
23
-
24
-
25
-
26
-
27
-
28
-
29
-
30
-
31
-
32
-
33
-
34
-
35
-
36
-
37
-
38
-
39
-
40
-
41
-
42
-
43
-
44
-
45
-
46
-
47
-
 48
48 -
 49
49 -
 50
50 -
 51
51 -
 52
52 -
 53
53 -
 54
54 -
 55
55 -
 56
56 -
 57
57 -
 58
58 -
 59
59 -
 60
60 -
 61
61 -
 62
62 -
 63
63 -
 64
64 -
 65
65 -
 66
66 -
 67
67 -
 68
68 -
69
-
70
-
71
-
72
-
73
-
74
-
75
-
76
-
77
-
78
-
79
-
80
-
81
-
82
-
83
-
84
-
85
-
86
-
87
-
88
-
89
-
90
-
91
-
92
-
93
-
94
-
95
-
96
-
97
-
98
-
99
-
100
-
101
-
102
-
103
-
104
-
105
-
106
-
107
-
108
-
109
-
110
-
111
-
112
-
113
-
114
-
115
-
116
-
117
-
118
-
119
-
120
-
121
-
122
-
123
-
124
-
125
-
126
-
127
-
128
-
129
-
130
-
131
-
132
-
133
-
134
-
135
-
136
-
137
-
138
-
139
-
140
-
141
-
142
-
143
-
144
-
145
-
146
-
147
-
148
-
149
-
150
-
151
-
152
-
153
-
154
-
155
-
156
-
157
-
158
 |
 |

58
Primarily as a result of lower mortgage activity, management currently expects average total loans to increase in the range of
1% to 2% annualized during the first quarter of 2014.
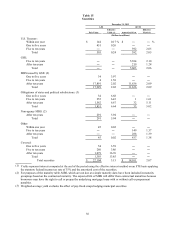
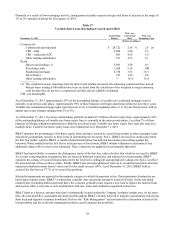
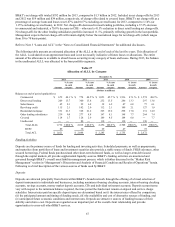
Table 17
Variable Rate Loans (Excluding Covered and LHFS)
December 31, 2013
Outstanding
Balance
Wtd. Avg.
Contractual
Rate
Wtd. Avg.
Remaining Term
(Dollars in millions)
Commercial:
Commercial and industrial $ 28,722 2.58 % 2.8 yrs
CRE - other 9,054 3.40 3.5
CRE - residential ADC 881 4.56 1.0
Other lending subsidiaries 531 4.15 2.1
Retail:
Direct retail lending (1) 5,892 3.58 8.3
Revolving credit 2,029 9.18 NM
Residential mortgage 6,758 3.55 25.5
Sales finance 917 1.99 0.8
Other lending subsidiaries ― N/A N/A
(1) The weighted average remaining term for direct retail lending represents the remaining contractual draw period.
Margin loans totaling $108 million have been excluded from the calculation of the weighted average remaining
term because they do not have a contractual end date and are callable on demand.
N
M - not meaningful.
As of December 31, 2013, approximately 24% of the outstanding balance of variable rate residential mortgage loans is
currently in an interest-only phase. Approximately 69% of these balances will begin amortizing within the next three years.
Variable rate residential mortgage loans typically reset every 12 months beginning after a 3 to 10 year fixed period, with an
annual cap on rate changes ranging from 2% to 6%.
As of December 31, 2013, the direct retail lending portfolio includes $5.2 billion of home equity lines. Approximately 66%
of the outstanding balance of variable rate home equity lines is currently in the interest-only phase. Less than 7% of these
balances will begin scheduled amortization within the next three years. Variable rate home equity lines typically reset on a
monthly basis. Variable rate home equity loans were immaterial as of December 31, 2013.
BB&T monitors the performance of its home equity loans and lines secured by second liens similar to other consumer loans
and utilizes assumptions specific to these loans in determining the necessary ALLL. BB&T also receives notification when
the first lien holder, whether BB&T or another financial institution, has initiated foreclosure proceedings against the
borrower. When notified that the first lien is in the process of foreclosure, BB&T obtains valuations to determine if any
additional charge-offs or reserves are warranted. These valuations are updated at least annually thereafter.
BB&T has limited ability to monitor the delinquency status of the first lien, unless the first lien is held or serviced by BB&T.
As a result, using migration assumptions that are based on historical experience and adjusted for current trends, BB&T
estimates the volume of second lien positions where the first lien is delinquent and appropriately adjusts the ALLL to reflect
the increased risk of loss on these credits. Finally, BB&T also provides additional reserves to second lien positions when the
estimated combined current loan to value ratio for the credit exceeds 100%. As of December 31, 2013, BB&T held or
serviced the first lien on 37.7% of its second lien positions.
Scheduled repayments are reported in the maturity category in which the payment is due. Determinations of maturities are
based upon contract terms. BB&T’s credit policy typically does not permit automatic renewal of loans. At the scheduled
maturity date (including balloon payment date), the customer generally must request a new loan to replace the matured loan
and execute either a new note or note modification with rate, terms and conditions negotiated at that time.
BB&T lends to a diverse customer base that is substantially located within the Company’s primary market area. At the same
time, the loan portfolio is geographically dispersed throughout BB&T’s branch network to mitigate concentration risk arising
from local and regional economic downturns. Refer to the “Risk Management” section herein for a discussion of each of the
loan portfolios and the credit risk management policies used to manage the portfolios.