BB&T 2013 Annual Report Download - page 35
Download and view the complete annual report
Please find page 35 of the 2013 BB&T annual report below. You can navigate through the pages in the report by either clicking on the pages listed below, or by using the keyword search tool below to find specific information within the annual report.-
 1
1 -
2
-
3
-
4
-
5
-
6
-
7
-
8
-
9
-
10
-
11
-
12
-
13
-
14
-
15
-
16
-
17
-
18
-
19
-
20
-
21
-
22
-
23
-
24
-
 25
25 -
 26
26 -
 27
27 -
 28
28 -
 29
29 -
 30
30 -
 31
31 -
 32
32 -
 33
33 -
 34
34 -
 35
35 -
 36
36 -
 37
37 -
 38
38 -
 39
39 -
 40
40 -
 41
41 -
 42
42 -
 43
43 -
 44
44 -
 45
45 -
46
-
47
-
48
-
49
-
50
-
51
-
52
-
53
-
54
-
55
-
56
-
57
-
58
-
59
-
60
-
61
-
62
-
63
-
64
-
65
-
66
-
67
-
68
-
69
-
70
-
71
-
72
-
73
-
74
-
75
-
76
-
77
-
78
-
79
-
80
-
81
-
82
-
83
-
84
-
85
-
86
-
87
-
88
-
89
-
90
-
91
-
92
-
93
-
94
-
95
-
96
-
97
-
98
-
99
-
100
-
101
-
102
-
103
-
104
-
105
-
106
-
107
-
108
-
109
-
110
-
111
-
112
-
113
-
114
-
115
-
116
-
117
-
118
-
119
-
120
-
121
-
122
-
123
-
124
-
125
-
126
-
127
-
128
-
129
-
130
-
131
-
132
-
133
-
134
-
135
-
136
-
137
-
138
-
139
-
140
-
141
-
142
-
143
-
144
-
145
-
146
-
147
-
148
-
149
-
150
-
151
-
152
-
153
-
154
-
155
-
156
-
157
-
158
 |
 |

35
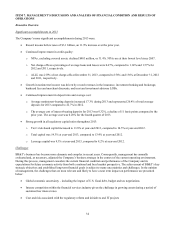
Overview of Significant Events and Financial Results
BB&T generated strong operating results for 2013, despite the challenges associated with the continued low interest rate
environment, increased costs associated with certain regulatory initiatives and intense competition for loans to qualified
borrowers. From a NIM perspective, the negative impact associated with lower yields on new loans and securities was
partially mitigated by a 15.9% decrease in funding costs, primarily driven by a decline in the cost of interest-bearing deposits
to 0.32% compared to 0.43% in the prior year. The provision for credit losses declined 44.0% compared to the prior year,
reflecting continued improvement in credit quality. Noninterest income increased compared to the prior year, based on record
insurance income, investment banking and brokerage fees and commissions, bankcard fees and merchant discounts and trust
and investment advisory revenues, while noninterest expense was essentially flat compared to the prior year, despite
significant costs associated with systems, process-related enhancements and regulatory costs.
Consolidated net income available to common shareholders for 2013 totaled $1.6 billion, a decrease of $354 million, or
18.5%, compared to $1.9 billion earned during 2012. On a diluted per common share basis, earnings for 2013 were $2.19,
compared to $2.70 for 2012. BB&T’s results of operations for 2013 produced a return on average assets of 0.95% and a
return on average common shareholders’ equity of 8.06% compared to prior year ratios of 1.14% and 10.35%, respectively.
During 2013, BB&T recognized $516 million in adjustments to the provision for income taxes. On September 20, 2013, the
U.S. Court of Federal Claims denied BB&T’s refund claim related to the IRS’s disallowance of tax deductions and foreign
tax credits taken in connection with a financing transaction entered into by BB&T in 2002. BB&T has appealed this ruling.
Excluding the impact of these adjustments, diluted EPS was $2.91 and the adjusted results of operations for 2013 produced
an annualized return on average assets of 1.24% and an annualized return on average common shareholders’ equity of
10.55%. See non-GAAP information on page 83.
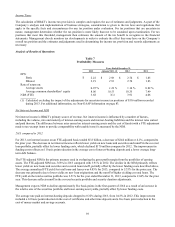
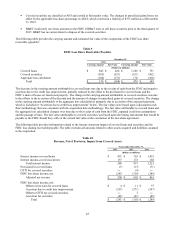
BB&T’s revenues for 2013 were $9.7 billion on a FTE basis, a decrease of 1.3% compared to 2012. Net interest income on a
FTE basis was $244 million lower than the prior year, which reflects a $414 million decrease in interest income that was
partially offset by a decrease in funding costs totaling $170 million. Noninterest income increased 3.1% compared to 2012,
which reflects solid growth in insurance income, trust and investment advisory revenues and bankcard fees and merchant
discounts totaling 11.6%, 8.7% and 8.5%, respectively. These increases were partially offset by a 32.7% decrease in
mortgage banking income.
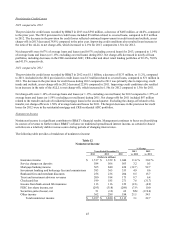
Credit costs declined significantly during 2013 as NPAs, excluding covered assets, declined $483 million, or 31.4%,
compared to 2012. This decline included a $445 million decrease in NPLs and a $38 million decrease in foreclosed real estate
and other property. Net charge-offs for 2013, excluding covered, were $773 million, a decrease of $487 million, or 38.7%,
compared to the prior year. BB&T’s provision for credit losses, excluding covered, totaled $587 million in 2013, compared to
$1.0 billion in the prior year. The ratio of the ALLL to net charge-offs excluding covered was 2.09x for 2013, compared to
1.50x in 2012. Foreclosed property expenses declined $211 million, or 79.3%, during 2013, reflecting fewer losses and write-
downs related to foreclosed property.
BB&T’s total assets at December 31, 2013 were $183.0 billion, a decrease of $1.5 billion compared to December 31, 2012.
This decline includes a $1.2 billion decrease in total loans and leases, a $900 million decrease in cash and cash equivalents
and a $1.0 billion decrease in other assets. These decreases were partially offset by a $1.5 billion increase in the securities
portfolio. The decrease in the total loan and lease portfolio was primarily driven by a $2.5 billion decrease in LHFS and a
$1.3 billion decrease in the covered loan portfolio, partially offset by a $2.6 billion increase in loans and leases held for
investment. The increase in the total securities portfolio is primarily the result of increased securities purchases during the
fourth quarter of 2013, which occurred in response to a decrease in loan originations. The decrease in other assets primarily
relates to the previously described income tax adjustments.
Total deposits at December 31, 2013 were $127.5 billion, a decrease of $5.6 billion, or 4.2%, from December 31, 2012. The
decrease in deposits reflects a decrease in certificates and other time deposits and interest checking totaling $6.7 billion and
$2.2 billion, respectively. These decreases were partially offset by an increase in noninterest-bearing deposits totaling $2.5
billion. These changes resulted in a substantial improvement to deposit mix, with noninterest-bearing accounts representing
27.4% of total deposits at December 31, 2013, compared to 24.4% at December 31, 2012. The cost of interest-bearing
deposits for 2013 declined 11 basis points compared to the prior year.
Total shareholders’ equity increased $1.6 billion, or 7.5%, compared to December 31, 2012. This increase was primarily
driven by net income in excess of dividends totaling $915 million and proceeds from the issuance of Tier 1 qualifying Series
G Non-Cumulative Preferred Stock totaling $487 million. BB&T’s Tier 1 risk-based capital and total risk-based capital ratios
at December 31, 2013 increased to 11.8% and 14.3%, respectively, compared to 10.5% and 13.4% at December 31, 2012,
respectively. BB&T’s risk-based capital ratios remain well above regulatory standards for well-capitalized banks.