BB&T 2013 Annual Report Download - page 102
Download and view the complete annual report
Please find page 102 of the 2013 BB&T annual report below. You can navigate through the pages in the report by either clicking on the pages listed below, or by using the keyword search tool below to find specific information within the annual report.-
 1
1 -
2
-
3
-
4
-
5
-
6
-
7
-
8
-
9
-
10
-
11
-
12
-
13
-
14
-
15
-
16
-
17
-
18
-
19
-
20
-
21
-
22
-
23
-
24
-
25
-
26
-
27
-
28
-
29
-
30
-
31
-
32
-
33
-
34
-
35
-
36
-
37
-
38
-
39
-
40
-
41
-
42
-
43
-
44
-
45
-
46
-
47
-
48
-
49
-
50
-
51
-
52
-
53
-
54
-
55
-
56
-
57
-
58
-
59
-
60
-
61
-
62
-
63
-
64
-
65
-
66
-
67
-
68
-
69
-
70
-
71
-
72
-
73
-
74
-
75
-
76
-
77
-
78
-
79
-
80
-
81
-
82
-
83
-
84
-
85
-
86
-
87
-
88
-
89
-
90
-
91
-
 92
92 -
 93
93 -
 94
94 -
 95
95 -
 96
96 -
 97
97 -
 98
98 -
 99
99 -
 100
100 -
 101
101 -
 102
102 -
 103
103 -
 104
104 -
 105
105 -
 106
106 -
 107
107 -
 108
108 -
 109
109 -
 110
110 -
 111
111 -
 112
112 -
113
-
114
-
115
-
116
-
117
-
118
-
119
-
120
-
121
-
122
-
123
-
124
-
125
-
126
-
127
-
128
-
129
-
130
-
131
-
132
-
133
-
134
-
135
-
136
-
137
-
138
-
139
-
140
-
141
-
142
-
143
-
144
-
145
-
146
-
147
-
148
-
149
-
150
-
151
-
152
-
153
-
154
-
155
-
156
-
157
-
158
 |
 |
102
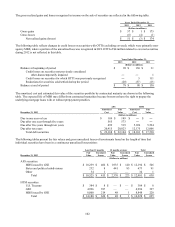
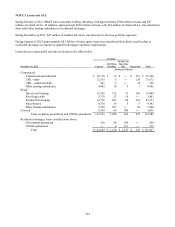
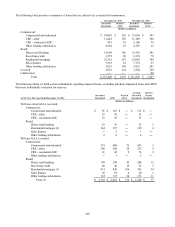
The gross realized gains and losses recognized in income on the sale of securities are reflected in the following table:
Years Ended December 31,
2013 2012 2011
(Dollars in millions)
Gross gains $ 57 $ 1 $ 175
Gross losses (6) (4) (1)
N
et realized gains (losses) $ 51 $ (3) $ 174
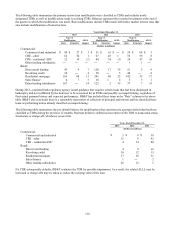
The following table reflects changes in credit losses on securities with OTTI (excluding covered), which were primarily non-
agency MBS, where a portion of the unrealized loss was recognized in OCI. OTTI of $4 million related to covered securities
during 2012 is not reflected in this table.
Years Ended December 31,
2013 2012 2011
(Dollars in millions)
Balance at beginning of period $ 98 $ 130 $ 31
Credit losses on securities not previously considered
other-than-temporarily impaired ― ― 1
Credit losses on securities for which OTTI was previously recognized ― 5 111
Reductions for securities sold/settled during the period (20) (37) (13)
Balance at end of period $ 78 $ 98 $ 130
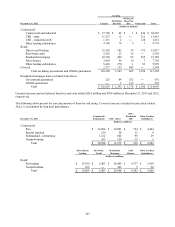
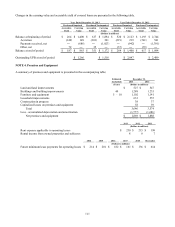
The amortized cost and estimated fair value of the securities portfolio by contractual maturity are shown in the following
table. The expected life of MBS may differ from contractual maturities because borrowers have the right to prepay the
underlying mortgage loans with or without prepayment penalties.
AFS HTM
Amortized Fair Amortized Fair
December 31, 2013 Cost Value Cost Value
(Dollars in millions)
Due in one year or less $ 189 $ 189 $ ― $ ―
Due after one year through five years 565 573 ― ―
Due after five years through ten years 499 519 5,926 5,524
Due after ten years 20,915 20,823 12,175 12,006
Total debt securities $ 22,168 $ 22,104 $ 18,101 $ 17,530
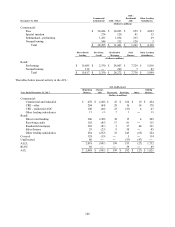
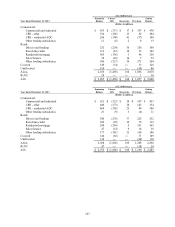
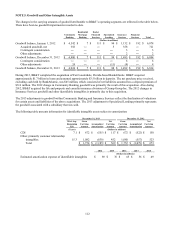
The following tables present the fair values and gross unrealized losses of investments based on the length of time that
individual securities have been in a continuous unrealized loss position:
Less than 12 months 12 months or more Total
Fair Unrealized Fair Unrealized Fair Unrealized
December 31, 2013 Value Losses Value Losses Value Losses
(Dollars in millions)
AFS securities:
MBS issued by GSE $ 10,259 $ 406 $ 1,935 $ 140 $ 12,194 $ 546
States and political subdivisions 232 8 441 83 673 91
Other 34 1 — — 34 1
Total $ 10,525 $ 415 $ 2,376 $ 223 $ 12,901 $ 638
HTM securities:
U.S. Treasury $384 $ 8 $ — $ — $ 384 $ 8
GSE 4,996 397 — — 4,996 397
MBS issued by GSE 8,800 219 48 1 8,848 220
Total $ 14,180 $ 624 $ 48 $ 1 $ 14,228 $ 625