BB&T 2013 Annual Report Download - page 104
Download and view the complete annual report
Please find page 104 of the 2013 BB&T annual report below. You can navigate through the pages in the report by either clicking on the pages listed below, or by using the keyword search tool below to find specific information within the annual report.-
 1
1 -
2
-
3
-
4
-
5
-
6
-
7
-
8
-
9
-
10
-
11
-
12
-
13
-
14
-
15
-
16
-
17
-
18
-
19
-
20
-
21
-
22
-
23
-
24
-
25
-
26
-
27
-
28
-
29
-
30
-
31
-
32
-
33
-
34
-
35
-
36
-
37
-
38
-
39
-
40
-
41
-
42
-
43
-
44
-
45
-
46
-
47
-
48
-
49
-
50
-
51
-
52
-
53
-
54
-
55
-
56
-
57
-
58
-
59
-
60
-
61
-
62
-
63
-
64
-
65
-
66
-
67
-
68
-
69
-
70
-
71
-
72
-
73
-
74
-
75
-
76
-
77
-
78
-
79
-
80
-
81
-
82
-
83
-
84
-
85
-
86
-
87
-
88
-
89
-
90
-
91
-
92
-
93
-
 94
94 -
 95
95 -
 96
96 -
 97
97 -
 98
98 -
 99
99 -
 100
100 -
 101
101 -
 102
102 -
 103
103 -
 104
104 -
 105
105 -
 106
106 -
 107
107 -
 108
108 -
 109
109 -
 110
110 -
 111
111 -
 112
112 -
 113
113 -
 114
114 -
115
-
116
-
117
-
118
-
119
-
120
-
121
-
122
-
123
-
124
-
125
-
126
-
127
-
128
-
129
-
130
-
131
-
132
-
133
-
134
-
135
-
136
-
137
-
138
-
139
-
140
-
141
-
142
-
143
-
144
-
145
-
146
-
147
-
148
-
149
-
150
-
151
-
152
-
153
-
154
-
155
-
156
-
157
-
158
 |
 |

104
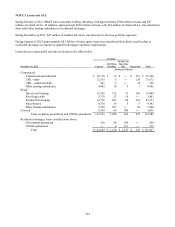
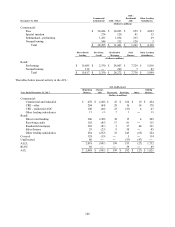
NOTE 3. Loans and ACL
During October of 2013, BB&T sold a consumer lending subsidiary with approximately $500 million in loans and $27
million of related ALLL. In addition, approximately $230 million of loans, with $38 million of related ALLL, was transferred
from retail other lending subsidiaries to residential mortgage.
During December of 2013, $47 million of unallocated ALLL was allocated to the loan portfolio segments.
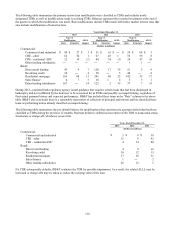
During January of 2014, approximately $8.3 billion of home equity loans were transferred from direct retail lending to
residential mortgage in response to qualified mortgage regulatory requirements.
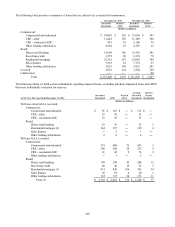
Loans that are contractually past due are shown in the tables below.
Accruing
90 Days Or
30-89 Days More Past
December 31, 2013 Current Past Due Due Nonaccrual Total
(Dollars in millions)
Commercial:
Commercial and industrial $ 38,110 $ 35 $ ― $ 363 $ 38,508
CRE - other 11,535 8 ― 129 11,672
CRE - residential ADC 901 2 ― 35 938
Other lending subsidiaries 4,482 14 5 1 4,502
Retail:
Direct retail lending 15,595 132 33 109 15,869
Revolving credit 2,370 23 10 ― 2,403
Residential mortgage 22,738 463 69 243 23,513
Sales finance 9,316 56 5 5 9,382
Other lending subsidiaries 5,703 207 ― 50 5,960
Covered 1,643 88 304 ― 2,035
Total excluding government and GNMA guaranteed 112,393 1,028 426 935 114,782
Residential mortgage loans excluded from above:
Government guaranteed 236 88 296 ― 620
GNMA guaranteed ― 4 511 ― 515
Total $ 112,629 $ 1,120 $ 1,233 $ 935 $ 115,917