BB&T 2013 Annual Report Download - page 125
Download and view the complete annual report
Please find page 125 of the 2013 BB&T annual report below. You can navigate through the pages in the report by either clicking on the pages listed below, or by using the keyword search tool below to find specific information within the annual report.-
 1
1 -
2
-
3
-
4
-
5
-
6
-
7
-
8
-
9
-
10
-
11
-
12
-
13
-
14
-
15
-
16
-
17
-
18
-
19
-
20
-
21
-
22
-
23
-
24
-
25
-
26
-
27
-
28
-
29
-
30
-
31
-
32
-
33
-
34
-
35
-
36
-
37
-
38
-
39
-
40
-
41
-
42
-
43
-
44
-
45
-
46
-
47
-
48
-
49
-
50
-
51
-
52
-
53
-
54
-
55
-
56
-
57
-
58
-
59
-
60
-
61
-
62
-
63
-
64
-
65
-
66
-
67
-
68
-
69
-
70
-
71
-
72
-
73
-
74
-
75
-
76
-
77
-
78
-
79
-
80
-
81
-
82
-
83
-
84
-
85
-
86
-
87
-
88
-
89
-
90
-
91
-
92
-
93
-
94
-
95
-
96
-
97
-
98
-
99
-
100
-
101
-
102
-
103
-
104
-
105
-
106
-
107
-
108
-
109
-
110
-
111
-
112
-
113
-
114
-
 115
115 -
 116
116 -
 117
117 -
 118
118 -
 119
119 -
 120
120 -
 121
121 -
 122
122 -
 123
123 -
 124
124 -
 125
125 -
 126
126 -
 127
127 -
 128
128 -
 129
129 -
 130
130 -
 131
131 -
 132
132 -
 133
133 -
 134
134 -
 135
135 -
136
-
137
-
138
-
139
-
140
-
141
-
142
-
143
-
144
-
145
-
146
-
147
-
148
-
149
-
150
-
151
-
152
-
153
-
154
-
155
-
156
-
157
-
158
 |
 |

125
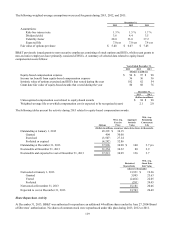
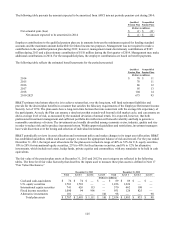
The following table presents the amount expected to be amortized from AOCI into net periodic pension cost during 2014:
Qualified Nonqualified
Pension Plan Pension Plans
(Dollars in millions)
N
et actuarial gain (loss) $ (1) $ (11)
N
et amount expected to be amortized in 2014 $ (1) $ (11)
Employer contributions to the qualified pension plan are in amounts between the minimum required for funding standard
accounts and the maximum amount deductible for federal income tax purposes. Management was not required to make a
contribution to the qualified pension plan during 2013; however, management made discretionary contributions of $345
million during 2013 and a discretionary contribution of $110 million during the first quarter of 2014. Management may make
additional contributions in 2014. For the nonqualified plans, the employer contributions are based on benefit payments.
The following table reflects the estimated benefit payments for the periods presented:
Qualified Nonqualified
Pension Plan Pension Plans
(Dollars in millions)
2014 $ 70 $ 11
2015 78 11
2016 86 12
2017 95 13
2018 104 14
2019-2023 673 95
BB&T's primary total return objective is to achieve returns that, over the long term, will fund retirement liabilities and
provide for the desired plan benefits in a manner that satisfies the fiduciary requirements of the Employee Retirement Income
Security Act of 1974. The plan assets have a long-term time horizon that runs concurrent with the average life expectancy of
the participants. As such, the Plan can assume a time horizon that extends well beyond a full market cycle, and can assume an
above-average level of risk, as measured by the standard deviation of annual return. It is expected, however, that both
professional investment management and sufficient portfolio diversification will smooth volatility and help to generate a
reasonable consistency of return. The investments are broadly diversified among economic sector, industry, quality and size
in order to reduce risk and to produce incremental return. Within approved guidelines and restrictions, investment managers
have wide discretion over the timing and selection of individual investments.
BB&T periodically reviews its asset allocation and investment policy and makes changes to its target asset allocation. BB&T
has established guidelines within each asset category to ensure the appropriate balance of risk and reward. For the year ended
December 31, 2013, the target asset allocations for the plan assets included a range of 40% to 52% for U.S. equity securities,
10% to 20% for international equity securities, 25% to 40% for fixed income securities, and 0% to 12% for alternative
investments, which include real estate, hedge funds, private equities and commodities, with any remainder to be held in cash
equivalents.
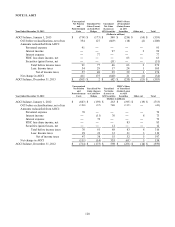
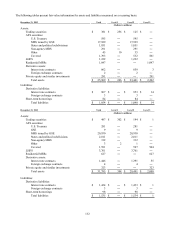
The fair value of the pension plan assets at December 31, 2013 and 2012 by asset category are reflected in the following
tables. The three level fair value hierarchy that describes the inputs used to measure these plan assets is defined in Note 17
"Fair Value Disclosures.”
December 31, 2013 December 31, 2012
Total Level 1 Level 2 Level 3 Total Level 1 Level 2 Level 3
(Dollars in millions)
Cash and cash-equivalents $ 74 $ 74 $ — $ — $ 89 $ 89 $ — $ —
U.S. equity securities 1,701 1,701 — — 1,226 1,226 — —
International equity securities 741 626 115 — 570 462 108 —
Fixed income securities 1,090 94 996 — 951 126 825 —
Alternative investments 101 — — 101 98 — — 98
Total plan assets $ 3,707 $ 2,495 $ 1,111 $ 101 $ 2,934 $ 1,903 $ 933 $ 98