BB&T 2013 Annual Report Download - page 142
Download and view the complete annual report
Please find page 142 of the 2013 BB&T annual report below. You can navigate through the pages in the report by either clicking on the pages listed below, or by using the keyword search tool below to find specific information within the annual report.-
 1
1 -
2
-
3
-
4
-
5
-
6
-
7
-
8
-
9
-
10
-
11
-
12
-
13
-
14
-
15
-
16
-
17
-
18
-
19
-
20
-
21
-
22
-
23
-
24
-
25
-
26
-
27
-
28
-
29
-
30
-
31
-
32
-
33
-
34
-
35
-
36
-
37
-
38
-
39
-
40
-
41
-
42
-
43
-
44
-
45
-
46
-
47
-
48
-
49
-
50
-
51
-
52
-
53
-
54
-
55
-
56
-
57
-
58
-
59
-
60
-
61
-
62
-
63
-
64
-
65
-
66
-
67
-
68
-
69
-
70
-
71
-
72
-
73
-
74
-
75
-
76
-
77
-
78
-
79
-
80
-
81
-
82
-
83
-
84
-
85
-
86
-
87
-
88
-
89
-
90
-
91
-
92
-
93
-
94
-
95
-
96
-
97
-
98
-
99
-
100
-
101
-
102
-
103
-
104
-
105
-
106
-
107
-
108
-
109
-
110
-
111
-
112
-
113
-
114
-
115
-
116
-
117
-
118
-
119
-
120
-
121
-
122
-
123
-
124
-
125
-
126
-
127
-
128
-
129
-
130
-
131
-
 132
132 -
 133
133 -
 134
134 -
 135
135 -
 136
136 -
 137
137 -
 138
138 -
 139
139 -
 140
140 -
 141
141 -
 142
142 -
 143
143 -
 144
144 -
 145
145 -
 146
146 -
 147
147 -
 148
148 -
 149
149 -
 150
150 -
 151
151 -
 152
152 -
153
-
154
-
155
-
156
-
157
-
158
 |
 |

142
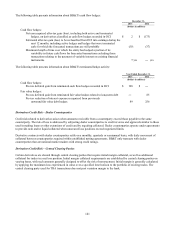
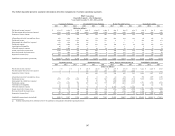
December 31,
2013 2012
(Dollars in millions)
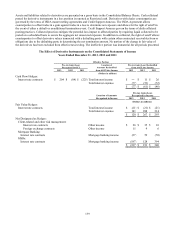
Cash collateral received from dealer counterparties $ 44 $ 44
Derivatives in a net gain position secured by that collateral 46 42
Unsecured positions in a net gain with dealer counterparties after collateral postings 3 ―
Cash collateral posted to dealer counterparties 356 603
Derivatives in a net loss position secured by that collateral 357 610
Additional collateral that would have been posted had BB&T's credit ratings
dropped below investment grade 4 10
Cash collateral, including initial margin, posted to central clearing parties 43 111
Derivatives in a net loss position secured by that collateral 43 7
Securities pledged to central clearing parties 82 ―
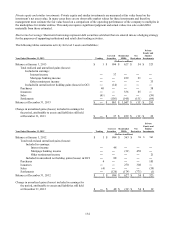
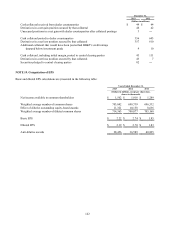
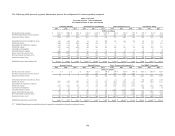
NOTE 19. Computation of EPS
Basic and diluted EPS calculations are presented in the following table:
Years Ended December 31,
2013 2012 2011
(Dollars in millions, except per share data,
shares in thousands)
N
et income available to common shareholders $ 1,562 $ 1,916 $ 1,289
Weighted average number of common shares 703,042 698,739 696,532
Effect of dilutive outstanding equity-based awards 11,321 10,138 8,636
Weighted average number of diluted common shares 714,363 708,877 705,168
Basic EPS $ 2.22 $ 2.74 $ 1.85
Diluted EPS $ 2.19 $ 2.70 $ 1.83
Anti-dilutive awards 28,456 36,589 40,895