BB&T 2013 Annual Report Download - page 40
Download and view the complete annual report
Please find page 40 of the 2013 BB&T annual report below. You can navigate through the pages in the report by either clicking on the pages listed below, or by using the keyword search tool below to find specific information within the annual report.-
 1
1 -
2
-
3
-
4
-
5
-
6
-
7
-
8
-
9
-
10
-
11
-
12
-
13
-
14
-
15
-
16
-
17
-
18
-
19
-
20
-
21
-
22
-
23
-
24
-
25
-
26
-
27
-
28
-
29
-
 30
30 -
 31
31 -
 32
32 -
 33
33 -
 34
34 -
 35
35 -
 36
36 -
 37
37 -
 38
38 -
 39
39 -
 40
40 -
 41
41 -
 42
42 -
 43
43 -
 44
44 -
 45
45 -
 46
46 -
 47
47 -
 48
48 -
 49
49 -
 50
50 -
51
-
52
-
53
-
54
-
55
-
56
-
57
-
58
-
59
-
60
-
61
-
62
-
63
-
64
-
65
-
66
-
67
-
68
-
69
-
70
-
71
-
72
-
73
-
74
-
75
-
76
-
77
-
78
-
79
-
80
-
81
-
82
-
83
-
84
-
85
-
86
-
87
-
88
-
89
-
90
-
91
-
92
-
93
-
94
-
95
-
96
-
97
-
98
-
99
-
100
-
101
-
102
-
103
-
104
-
105
-
106
-
107
-
108
-
109
-
110
-
111
-
112
-
113
-
114
-
115
-
116
-
117
-
118
-
119
-
120
-
121
-
122
-
123
-
124
-
125
-
126
-
127
-
128
-
129
-
130
-
131
-
132
-
133
-
134
-
135
-
136
-
137
-
138
-
139
-
140
-
141
-
142
-
143
-
144
-
145
-
146
-
147
-
148
-
149
-
150
-
151
-
152
-
153
-
154
-
155
-
156
-
157
-
158
 |
 |

40
The rates paid on average short-term borrowings declined from 0.26% in 2012 to 0.16% during 2013. At December 31, 2013,
the targeted Federal funds rate was a range of zero percent to 0.25%. The average rate on long-term debt during 2013 was
3.03%, an increase of one basis point compared to the prior year. This increase reflects the redemption of all higher cost
junior subordinated debt to unconsolidated trusts and the related benefit associated with accelerated amortization of
derivatives that were unwound in a gain position during 2012, partially offset by lower effective rates on new debt issued
during 2013.
2012 compared to 2011
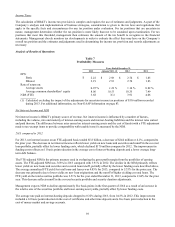
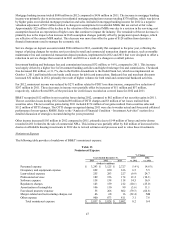
For 2012, net interest income on an FTE-adjusted basis totaled $6.0 billion, compared with $5.7 billion in 2011, an increase
of 6.2%. The increase in net interest income was driven by lower funding costs, which declined $319 million compared to
2011. The improvement in funding costs reflects a 25 basis point reduction in the average cost of interest-bearing deposits for
2012 compared to the prior year and the 2012 redemption of all junior subordinated debt to unconsolidated trusts. Net interest
income also benefited from the growth in average earning assets, which more than offset the negative impact of lower yields
on new loans.
FTE-adjusted NIM was 3.91% in 2012 compared with 4.06% in 2011. The decline in the NIM primarily reflects the runoff of
higher yielding covered loans and lower yields on new loans, partially offset by the lower funding costs described above. The
average annualized FTE yield for 2012 for the total loan portfolio was 5.35% compared to 5.87% for the prior year. The
decrease was primarily due to the runoff of higher yielding covered loans and a higher volume of new loans originated at
lower rates. The FTE yield on the total securities portfolio was 2.64% for the year ended December 31, 2012, compared to
2.67% for the prior year. The decrease reflects a higher volume of lower yielding RMBS securities issued by GSEs.
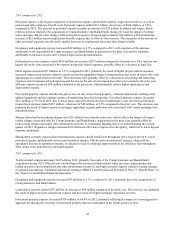
The average rate paid on interest-bearing deposits dropped to 0.43% during 2012 from 0.68% in 2011. This improvement
was a result of lower rates on interest-bearing deposits, including a 56 basis point reduction in the cost of certificates and
other time deposits and a 13 basis point reduction in the cost of money market and savings accounts.
The rates paid on average short-term borrowings declined from 0.27% in 2011 to 0.26% during 2012. At December 31, 2012,
the targeted Federal funds rate was a range of zero percent to 0.25%. The average rate on long-term debt during 2012 was
3.02%, a decrease of 38 basis points compared to the prior year. This reduction was primarily due to the redemption of all
higher cost junior subordinated debt to unconsolidated trusts during 2012 and the related benefit associated with accelerated
amortization of derivatives that were unwound in a gain position.
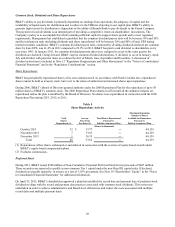
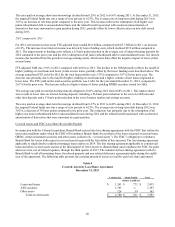
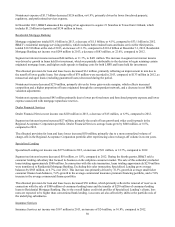
Covered Assets and FDIC Loss Share Receivable/Payable
In connection with the Colonial acquisition, Branch Bank entered into loss sharing agreements with the FDIC that outline the
terms and conditions under which the FDIC will reimburse Branch Bank for a portion of the losses incurred on certain loans,
OREO, certain investment securities and other assets (collectively, “covered assets”). The FDIC’s obligation to reimburse
Branch Bank for losses with respect to covered assets began with the first dollar of loss incurred. The loss sharing agreement
applicable to single family residential mortgage loans expires in 2019. The loss sharing agreement applicable to commercial
loans and other covered assets expires in the third quarter of 2014; however, Branch Bank must reimburse the FDIC for gains
and recoveries, net of related expenses, through the third quarter of 2017. The commercial loss sharing agreement calls for
Branch Bank to sell all remaining loans, foreclosed property and any related deficiency agreements/rights during the eighth
year of the agreement. The following table presents the carrying amount of assets covered by each loss share agreement:
Table 8
Covered Assets by Loss Share Agreement
December 31, 2013
Commercial Single Family Total
(dollars in millions)
Loans and leases $ 1,263 $ 772 $ 2,035
AFS securities 1,393 ― 1,393
Other assets 124 39 163
Total covered assets $ 2,780 $ 811 $ 3,591