BB&T 2013 Annual Report Download - page 130
Download and view the complete annual report
Please find page 130 of the 2013 BB&T annual report below. You can navigate through the pages in the report by either clicking on the pages listed below, or by using the keyword search tool below to find specific information within the annual report.-
 1
1 -
2
-
3
-
4
-
5
-
6
-
7
-
8
-
9
-
10
-
11
-
12
-
13
-
14
-
15
-
16
-
17
-
18
-
19
-
20
-
21
-
22
-
23
-
24
-
25
-
26
-
27
-
28
-
29
-
30
-
31
-
32
-
33
-
34
-
35
-
36
-
37
-
38
-
39
-
40
-
41
-
42
-
43
-
44
-
45
-
46
-
47
-
48
-
49
-
50
-
51
-
52
-
53
-
54
-
55
-
56
-
57
-
58
-
59
-
60
-
61
-
62
-
63
-
64
-
65
-
66
-
67
-
68
-
69
-
70
-
71
-
72
-
73
-
74
-
75
-
76
-
77
-
78
-
79
-
80
-
81
-
82
-
83
-
84
-
85
-
86
-
87
-
88
-
89
-
90
-
91
-
92
-
93
-
94
-
95
-
96
-
97
-
98
-
99
-
100
-
101
-
102
-
103
-
104
-
105
-
106
-
107
-
108
-
109
-
110
-
111
-
112
-
113
-
114
-
115
-
116
-
117
-
118
-
119
-
 120
120 -
 121
121 -
 122
122 -
 123
123 -
 124
124 -
 125
125 -
 126
126 -
 127
127 -
 128
128 -
 129
129 -
 130
130 -
 131
131 -
 132
132 -
 133
133 -
 134
134 -
 135
135 -
 136
136 -
 137
137 -
 138
138 -
 139
139 -
 140
140 -
141
-
142
-
143
-
144
-
145
-
146
-
147
-
148
-
149
-
150
-
151
-
152
-
153
-
154
-
155
-
156
-
157
-
158
 |
 |

130
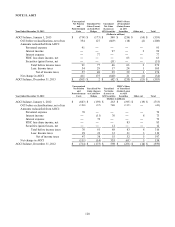
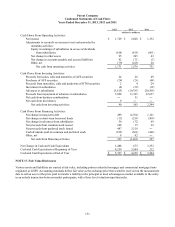
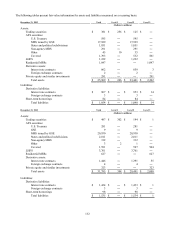
Parent Company
Condensed Income Statements
Years Ended December 31, 2013, 2012 and 2011
2013 2012 2011
(Dollars in millions)
Income:
Dividends from banking subsidiaries $ 1,220 $ 1,720 $ 620
Dividends from other subsidiaries 79 81 278
Interest and other income from subsidiaries 67 79 107
Other income 14 1 8
Total income 1,380 1,881 1,013
Expenses:
Interest expense 219 239 334
Other expenses 50 52 34
Total expenses 269 291 368
Income before income taxes and equity in
undistributed earnings of subsidiaries 1,111 1,590 645
Income tax benefit 2 20 26
Income before equity in undistributed earnings of subsidiaries 1,113 1,610 671
Equity in undistributed earnings of subsidiaries in excess of
dividends from subsidiaries 616 418 661
N
et income 1,729 2,028 1,332
N
oncontrolling interests 50 49 43
Dividends on preferred stock 117 63 ―
N
et income available to common shareholders $ 1,562 $ 1,916 $ 1,289
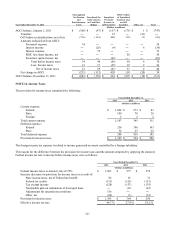
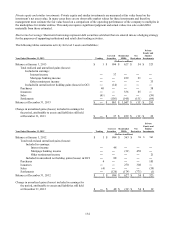
Parent Company
Condensed Statements of Comprehensive Income
Years Ended December 31, 2013, 2012 and 2011
2013 2012 2011
(Dollars in millions)
N
et Income $ 1,729 $ 2,028 $ 1,332
OCI, Net of Tax:
Change in unrecognized pension and postretirement amounts (4) ― ―
Change in unrecognized gains (losses) on cash flow hedges ― (2) (1)
Other, net 1 1 (8)
Total OCI (3) (1) (9)
Total comprehensive income $ 1,726 $ 2,027 $ 1,323
Income Tax Effect of Items Included in OCI
Change in unrecognized pension and postretirement amounts $ (1) $ ― $ ―
Change in unrecognized gains (losses) on cash flow hedges ― (1) ―
Other, net ― ― (4)