BB&T 2013 Annual Report Download - page 53
Download and view the complete annual report
Please find page 53 of the 2013 BB&T annual report below. You can navigate through the pages in the report by either clicking on the pages listed below, or by using the keyword search tool below to find specific information within the annual report.-
 1
1 -
2
-
3
-
4
-
5
-
6
-
7
-
8
-
9
-
10
-
11
-
12
-
13
-
14
-
15
-
16
-
17
-
18
-
19
-
20
-
21
-
22
-
23
-
24
-
25
-
26
-
27
-
28
-
29
-
30
-
31
-
32
-
33
-
34
-
35
-
36
-
37
-
38
-
39
-
40
-
41
-
42
-
 43
43 -
 44
44 -
 45
45 -
 46
46 -
 47
47 -
 48
48 -
 49
49 -
 50
50 -
 51
51 -
 52
52 -
 53
53 -
 54
54 -
 55
55 -
 56
56 -
 57
57 -
 58
58 -
 59
59 -
 60
60 -
 61
61 -
 62
62 -
 63
63 -
64
-
65
-
66
-
67
-
68
-
69
-
70
-
71
-
72
-
73
-
74
-
75
-
76
-
77
-
78
-
79
-
80
-
81
-
82
-
83
-
84
-
85
-
86
-
87
-
88
-
89
-
90
-
91
-
92
-
93
-
94
-
95
-
96
-
97
-
98
-
99
-
100
-
101
-
102
-
103
-
104
-
105
-
106
-
107
-
108
-
109
-
110
-
111
-
112
-
113
-
114
-
115
-
116
-
117
-
118
-
119
-
120
-
121
-
122
-
123
-
124
-
125
-
126
-
127
-
128
-
129
-
130
-
131
-
132
-
133
-
134
-
135
-
136
-
137
-
138
-
139
-
140
-
141
-
142
-
143
-
144
-
145
-
146
-
147
-
148
-
149
-
150
-
151
-
152
-
153
-
154
-
155
-
156
-
157
-
158
 |
 |

53
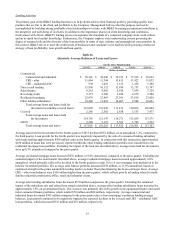
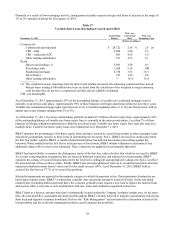
Net interest income increased $97 million, or 20.9%, to $562 million in 2012. This increase was primarily due to strong loan
growth by Sheffield Financial as the result of dealer volume growth and expanded dealer relationships. Additionally,
Mortgage Warehouse Lending benefited from increased market penetration, higher commitment levels and higher line usage,
while Lendmark and Equipment Finance realized higher NIM. Average loans for Specialized Lending grew by $2.0 billion,
or 15.6%, to $14.8 billion in 2012.
The allocated provision for loan and lease losses increased $63 million, or 87.5%, in 2012. The increase in provision expense
was primarily due to higher charge-offs in the consumer lending subsidiary and adjustments to loss factors resulting from an
acceleration of certain consumer loan charge-offs in the third quarter of 2012. Due to the overall higher credit risk profiles of
Specialized Lending’s clients, loss rates are expected to be higher than conventional bank lending. Loss rates are also
affected by shifts in the portfolio mix of the underlying subsidiaries.
Noninterest income increased $18 million, or 8.5%, to $229 million in 2012. The increase in noninterest income was driven
by higher operating lease income and gains on sale of finance lease equipment by Equipment Finance, as well as higher
commercial finance and commercial mortgage banking fees.
Noninterest expense increased $26 million, or 11.2%, to $259 million. The increase in noninterest expense was driven by
higher depreciation on property leased to customers by Equipment Finance, higher loan referral fees paid by Sheffield
Financial and higher personnel expense.
Insurance Services
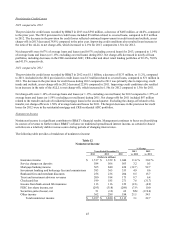
Insurance Services net income was $143 million in 2012, an increase of $41 million, or 40.2%, compared to 2011. The
increase in net income was driven by acquisitions and improving premium pricing in the property and casualty insurance
business.
Noninterest income increased $324 million, or 31.1%, to $1.4 billion. The increase in noninterest income was primarily
driven by higher life insurance, property and casualty insurance and employee benefits commissions. The life insurance and
property and casualty operations of Crump Insurance, which was acquired on April 2, 2012, contributed $234 million of
insurance income. Property and casualty insurance commission growth was partially attributable to improvement in premium
pricing compared to the prior year. Employee benefits commission growth was primarily due to the fourth quarter 2011
acquisitions of Precept, a full-service employee benefits consulting and administrative solutions firm with offices in Irvine
and San Ramon, California and Liberty Benefit Insurance Services, a full-service employee benefits broker located in San
Jose, California.
Noninterest expense increased $230 million, or 29.3%, in 2012. The increase in noninterest expenses was primarily due to the
Crump Insurance acquisition and related personnel expense, occupancy expense and amortization of intangibles.
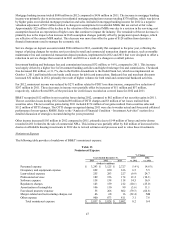
Financial Services
Financial Services net income was $284 million in 2012, up $20 million, or 7.6%, compared to 2011.
Segment net interest income increased $91 million, or 25.4%, to $449 million in 2012. The increase in segment net interest
income during 2012 was primarily attributable to strong organic loan and deposit growth by Corporate Banking and BB&T
Wealth, partially offset by a lower NIM for both businesses.
The allocated provision for loan and lease losses increased $14 million to $13 million in 2012 as the result of changes in the
composition of the commercial and industrial loan portfolio, combined with overall growth in the portfolio.
Noninterest income increased $36 million, or 5.3%, to $719 million in 2012. The increase in noninterest income was
primarily due to higher investment banking and brokerage fees and commissions, trust and investment advisory revenues and
commercial loan fees.
Noninterest expense increased $68 million, or 11.8%, to $643 million in 2012, primarily due to higher personnel expense and
intercompany expense. The increase in noninterest expense in 2012 was driven by continued efforts to expand the national
lending teams in Corporate Banking and by the associated increases in incentive expenses tied to the strong income growth in
the LOBs.