BB&T 2013 Annual Report Download - page 87
Download and view the complete annual report
Please find page 87 of the 2013 BB&T annual report below. You can navigate through the pages in the report by either clicking on the pages listed below, or by using the keyword search tool below to find specific information within the annual report.-
 1
1 -
2
-
3
-
4
-
5
-
6
-
7
-
8
-
9
-
10
-
11
-
12
-
13
-
14
-
15
-
16
-
17
-
18
-
19
-
20
-
21
-
22
-
23
-
24
-
25
-
26
-
27
-
28
-
29
-
30
-
31
-
32
-
33
-
34
-
35
-
36
-
37
-
38
-
39
-
40
-
41
-
42
-
43
-
44
-
45
-
46
-
47
-
48
-
49
-
50
-
51
-
52
-
53
-
54
-
55
-
56
-
57
-
58
-
59
-
60
-
61
-
62
-
63
-
64
-
65
-
66
-
67
-
68
-
69
-
70
-
71
-
72
-
73
-
74
-
75
-
76
-
 77
77 -
 78
78 -
 79
79 -
 80
80 -
 81
81 -
 82
82 -
 83
83 -
 84
84 -
 85
85 -
 86
86 -
 87
87 -
 88
88 -
 89
89 -
 90
90 -
 91
91 -
 92
92 -
 93
93 -
 94
94 -
 95
95 -
 96
96 -
 97
97 -
98
-
99
-
100
-
101
-
102
-
103
-
104
-
105
-
106
-
107
-
108
-
109
-
110
-
111
-
112
-
113
-
114
-
115
-
116
-
117
-
118
-
119
-
120
-
121
-
122
-
123
-
124
-
125
-
126
-
127
-
128
-
129
-
130
-
131
-
132
-
133
-
134
-
135
-
136
-
137
-
138
-
139
-
140
-
141
-
142
-
143
-
144
-
145
-
146
-
147
-
148
-
149
-
150
-
151
-
152
-
153
-
154
-
155
-
156
-
157
-
158
 |
 |

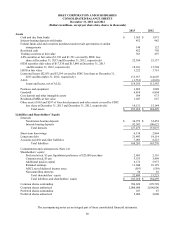
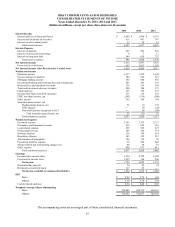
The accompanying notes are an integral part of these consolidated financial statements.
87
BB&T CORPORATION AND SUBSIDIARIES
CONSOLIDATED STATEMENTS OF INCOME
Years Ended December 31, 2013, 2012 and 2011
(Dollars in millions, except per share data, shares in thousands)
2013 2012 2011
Interest Income
Interest and fees on loans and leases $ 5,603 $ 5,980 $ 6,119
Interest and dividends on securities 871 907 747
Interest on other earning assets 33 30 19
Total interest income 6,507 6,917 6,885
Interest Expense
Interest on deposits 301 429 610
Interest on short-term borrowings 6 7 11
Interest on long-term debt 584 624 757
Total interest expense 891 1,060 1,378
Net Interest Income 5,616 5,857 5,507
Provision for credit losses 592 1,057 1,190
Net Interest Income After Provision for Credit Losses 5,024 4,800 4,317
Noninterest Income
Insurance income 1,517 1,359 1,044
Service charges on deposits 584 566 563
Mortgage banking income 565 840 436
Investment banking and brokerage fees and commissions 383 365 333
Bankcard fees and merchant discounts 256 236 204
Trust and investment advisory revenues 200 184 173
Checkcard fees 199 185 271
Income from bank-owned life insurance 113 116 122
FDIC loss share income, net (293) (318) (289)
Other income 362 299 194
Securities gains (losses), net
Realized gains (losses), net 51 (3) 174
OTTI charges ― (5) (22)
N
on-credit portion recognized in OCI ― (4) (90)
Total securities gains (losses), net 51 (12) 62
Total noninterest income 3,937 3,820 3,113
Noninterest Expense
Personnel expense 3,293 3,125 2,727
Occupancy and equipment expense 692 650 616
Loan-related expense 255 283 227
Professional services 189 156 174
Software expense 158 138 118
Regulatory charges 143 159 212
Amortization of intangibles 106 110 99
Foreclosed property expense 55 266 802
Merger-related and restructuring charges, net 46 68 16
Other expense 900 873 811
Total noninterest expense 5,837 5,828 5,802
Earnings
Income before income taxes 3,124 2,792 1,628
Provision for income taxes 1,395 764 296
Net income 1,729 2,028 1,332
N
oncontrolling interests 50 49 43
Dividends on preferred stock 117 63 ―
Net income available to common shareholders $ 1,562 $ 1,916 $ 1,289
EPS
Basic $ 2.22 $ 2.74 $ 1.85
Diluted $ 2.19 $ 2.70 $ 1.83
Cash dividends declared $ 0.92 $ 0.80 $ 0.65
Weighted Average Shares Outstanding
Basic 703,042 698,739 696,532
Diluted 714,363 708,877 705,168