BB&T 2013 Annual Report Download - page 45
Download and view the complete annual report
Please find page 45 of the 2013 BB&T annual report below. You can navigate through the pages in the report by either clicking on the pages listed below, or by using the keyword search tool below to find specific information within the annual report.-
 1
1 -
2
-
3
-
4
-
5
-
6
-
7
-
8
-
9
-
10
-
11
-
12
-
13
-
14
-
15
-
16
-
17
-
18
-
19
-
20
-
21
-
22
-
23
-
24
-
25
-
26
-
27
-
28
-
29
-
30
-
31
-
32
-
33
-
34
-
 35
35 -
 36
36 -
 37
37 -
 38
38 -
 39
39 -
 40
40 -
 41
41 -
 42
42 -
 43
43 -
 44
44 -
 45
45 -
 46
46 -
 47
47 -
 48
48 -
 49
49 -
 50
50 -
 51
51 -
 52
52 -
 53
53 -
 54
54 -
 55
55 -
56
-
57
-
58
-
59
-
60
-
61
-
62
-
63
-
64
-
65
-
66
-
67
-
68
-
69
-
70
-
71
-
72
-
73
-
74
-
75
-
76
-
77
-
78
-
79
-
80
-
81
-
82
-
83
-
84
-
85
-
86
-
87
-
88
-
89
-
90
-
91
-
92
-
93
-
94
-
95
-
96
-
97
-
98
-
99
-
100
-
101
-
102
-
103
-
104
-
105
-
106
-
107
-
108
-
109
-
110
-
111
-
112
-
113
-
114
-
115
-
116
-
117
-
118
-
119
-
120
-
121
-
122
-
123
-
124
-
125
-
126
-
127
-
128
-
129
-
130
-
131
-
132
-
133
-
134
-
135
-
136
-
137
-
138
-
139
-
140
-
141
-
142
-
143
-
144
-
145
-
146
-
147
-
148
-
149
-
150
-
151
-
152
-
153
-
154
-
155
-
156
-
157
-
158
 |
 |

45
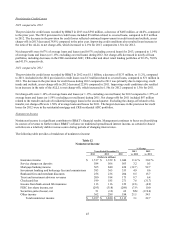
Provision for Credit Losses
2013 compared to 2012
The provision for credit losses recorded by BB&T in 2013 was $592 million, a decrease of $465 million, or 44.0%, compared
to the prior year. The 2013 provision for credit losses included $5 million related to covered loans, compared to $13 million
in 2012. The decrease in the provision for credit losses reflected continued improvement in credit trends and outlook, as net
charge-offs in 2013 decreased 38.8% compared to the prior year. Improving credit conditions also resulted in an increase in
the ratio of the ALLL to net charge-offs, which increased to 2.19x for 2013, compared to 1.56x for 2012.
Net charge-offs were 0.67% of average loans and leases (and 0.67% excluding covered loans) for 2013, compared to 1.14%
of average loans and leases (or 1.15% excluding covered loans) during 2012. Net charge-offs decreased in nearly all loan
portfolios, including decreases in the CRE-residential ADC, CRE-other and direct retail lending portfolios of 83.2%, 70.8%
and 41.5%, respectively.
2012 compared to 2011
The provision for credit losses recorded by BB&T in 2012 was $1.1 billion, a decrease of $133 million, or 11.2%, compared
to 2011. Included in the 2012 provision for credit losses was $13 million related to covered loans, compared to $71 million in
2011. The decrease in the provision for credit losses during 2012 compared to 2011 was primarily due to improving credit
trends and outlook, as net charge-offs in 2012 decreased 22.0% compared to 2011. Improving credit conditions also resulted
in an increase in the ratio of the ALLL to net charge-offs, which increased to 1.56x for 2012 compared to 1.36x for 2011.
Net charge-offs were 1.14% of average loans and leases (or 1.15% excluding covered loans) for 2012 compared to 1.57% of
average loans and leases (or 1.59% excluding covered loans) during 2011. Net charge-offs for 2011 included $87 million
related to the transfer and sale of residential mortgage loans in the second quarter. Excluding the charge-off related to this
transfer, net charge-offs were 1.50% of average loans and leases for 2011. The largest decreases in the provision for credit
losses for 2012 were in the residential mortgage and CRE-residential ADC portfolios.
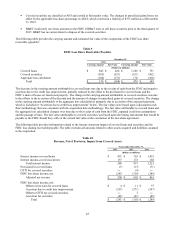
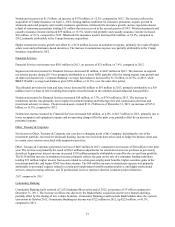
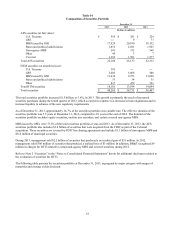
Noninterest Income
Noninterest income is a significant contributor to BB&T’s financial results. Management continues to focus on diversifying
its sources of revenue to further reduce BB&T’s reliance on traditional spread-based interest income, as certain fee-based
activities are a relatively stable revenue source during periods of changing interest rates.
The following table provides a breakdown of noninterest income:
Table 12
Noninterest Income
% Change
Years Ended December 31, 2013 2012
2013 2012 2011 vs. 2012 vs. 2011
(Dollars in millions)
Insurance income $ 1,517 $ 1,359 $ 1,044 11.6 % 30.2 %
Service charges on deposits 584 566 563 3.2 0.5
Mortgage banking income 565 840 436 (32.7) 92.7
Investment banking and brokerage fees and commissions 383 365 333 4.9 9.6
Bankcard fees and merchant discounts 256 236 204 8.5 15.7
Trust and investment advisory revenues 200 184 173 8.7 6.4
Checkcard fees 199 185 271 7.6 (31.7)
Income from bank-owned life insurance 113 116 122 (2.6) (4.9)
FDIC loss share income, net (293) (318) (289) (7.9) 10.0
Securities gains (losses), net 51 (12) 62 NM (119.4)
Other income 362 299 194 21.1 54.1
Total noninterest income $ 3,937 $ 3,820 $ 3,113 3.1 22.7