BB&T 2013 Annual Report Download - page 52
Download and view the complete annual report
Please find page 52 of the 2013 BB&T annual report below. You can navigate through the pages in the report by either clicking on the pages listed below, or by using the keyword search tool below to find specific information within the annual report.-
 1
1 -
2
-
3
-
4
-
5
-
6
-
7
-
8
-
9
-
10
-
11
-
12
-
13
-
14
-
15
-
16
-
17
-
18
-
19
-
20
-
21
-
22
-
23
-
24
-
25
-
26
-
27
-
28
-
29
-
30
-
31
-
32
-
33
-
34
-
35
-
36
-
37
-
38
-
39
-
40
-
41
-
 42
42 -
 43
43 -
 44
44 -
 45
45 -
 46
46 -
 47
47 -
 48
48 -
 49
49 -
 50
50 -
 51
51 -
 52
52 -
 53
53 -
 54
54 -
 55
55 -
 56
56 -
 57
57 -
 58
58 -
 59
59 -
 60
60 -
 61
61 -
 62
62 -
63
-
64
-
65
-
66
-
67
-
68
-
69
-
70
-
71
-
72
-
73
-
74
-
75
-
76
-
77
-
78
-
79
-
80
-
81
-
82
-
83
-
84
-
85
-
86
-
87
-
88
-
89
-
90
-
91
-
92
-
93
-
94
-
95
-
96
-
97
-
98
-
99
-
100
-
101
-
102
-
103
-
104
-
105
-
106
-
107
-
108
-
109
-
110
-
111
-
112
-
113
-
114
-
115
-
116
-
117
-
118
-
119
-
120
-
121
-
122
-
123
-
124
-
125
-
126
-
127
-
128
-
129
-
130
-
131
-
132
-
133
-
134
-
135
-
136
-
137
-
138
-
139
-
140
-
141
-
142
-
143
-
144
-
145
-
146
-
147
-
148
-
149
-
150
-
151
-
152
-
153
-
154
-
155
-
156
-
157
-
158
 |
 |

52
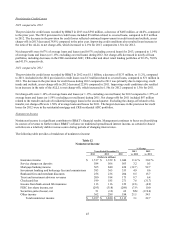
Segment net interest income totaled $3.4 billion in 2012 compared to $3.5 billion in 2011. The decrease in segment net
interest income was primarily attributable to lower funding credits on deposits as the result of declining interest rates. This
decrease was partially offset by loan growth and improvement in the deposit mix, which was the result of an increase in
noninterest-bearing deposits and a decrease in client CDs.
The allocated provision for loan and lease losses increased by $76 million, or 12.9%, to $665 million in 2012, primarily due
to growth in loan balances, partially offset by lower charge-offs.
Noninterest income increased $105 million, or 10.2%, to $1.1 billion in 2012, primarily due to higher bankcard and merchant
fees, as well as losses on commercial LHFS in the prior year. The increase in noninterest income was partially offset by
lower debit interchange and overdraft fees. Noninterest income allocated from other segments, which is reported as
intersegment net referral fees (“referral fees”), increased by $57 million, or 47.1% in 2012, driven by higher referrals for
residential mortgage lending as originations grew.
Noninterest expense declined $529 million, or 22.5%, to $1.8 billion for 2012. This decline was primarily due to lower
foreclosed property expense and regulatory charges, partially offset by higher net occupancy expense and personnel expense.
Allocated corporate expense increased $125 million, or 13.9%, to $1.0 billion in 2012, primarily due to increases in loan
administration, operations and marketing expense.
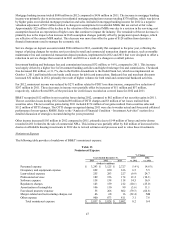
Residential Mortgage Banking
BB&T’s mortgage originations totaled $33.1 billion in 2012, up $9.4 billion, or 39.9%, compared to 2011. BB&T’s
residential mortgage servicing portfolio, which includes both retained loans and loans serviced for third parties, totaled
$101.3 billion at the end of 2012, an increase of 10.5%, compared to $91.6 billion at December 31, 2011. Residential
Mortgage Banking net income was $367 million in 2012, compared to a net loss of $15 million in 2011.
Segment net interest income increased $87 million, or 30.0%, to $377 million in 2012. The increase in segment net interest
income was primarily due to growth in LHFS, growth in loans held for investment and higher spreads to funding costs on
loans held for investment. These increases in segment net interest income were partially offset by lower spreads to funding
costs on LHFS.
The allocated provision for loan and lease losses was $95 million for 2012, down $225 million, or 70.3%, compared to $320
million in 2011. The decrease in provision expense reflects improved credit quality in the loan portfolio, as well as the sale of
NPLs in the second quarter of 2011, which resulted in higher charge-offs. Net charge-offs of $133 million were recorded in
2012 compared to $264 million in 2011.
Noninterest income increased from $351 million in 2011 to $754 million in 2012. This increase was primarily due to higher
mortgage loan production and sales and higher margins than in the prior year.
Noninterest expense increased $92 million, or 31.0%, to $389 million in 2012, reflecting higher loan-related and personnel
expenses. The increase in loan-related expense was driven by an increase in the loan repurchase reserve. The increase in
personnel expense was driven by a higher number of employees and incentives related to the increased production.
Dealer Financial Services
Dealer Financial Services net income was $218 million in 2012, an increase of $9 million, or 4.3%, compared to 2011.
Segment net interest income increased $66 million, or 11.3%, to $648 million in 2012. The increase in segment net interest
income was primarily due to loan growth and an improved NIM in Regional Acceptance Corporation’s point-of-sale loan
portfolio.
The allocated provision for loan and lease losses increased $39 million, or 31.2%, in 2012, primarily due to increases in
Regional Acceptance Corporation’s ALLL related to nonprime auto loans as delinquent accounts and NPAs move from
historical lows to more normalized levels.
Specialized Lending
Specialized Lending net income was $244 million in 2012, an increase of $9 million, or 3.8%, compared to 2011.