BB&T 2013 Annual Report Download - page 47
Download and view the complete annual report
Please find page 47 of the 2013 BB&T annual report below. You can navigate through the pages in the report by either clicking on the pages listed below, or by using the keyword search tool below to find specific information within the annual report.-
 1
1 -
2
-
3
-
4
-
5
-
6
-
7
-
8
-
9
-
10
-
11
-
12
-
13
-
14
-
15
-
16
-
17
-
18
-
19
-
20
-
21
-
22
-
23
-
24
-
25
-
26
-
27
-
28
-
29
-
30
-
31
-
32
-
33
-
34
-
35
-
36
-
 37
37 -
 38
38 -
 39
39 -
 40
40 -
 41
41 -
 42
42 -
 43
43 -
 44
44 -
 45
45 -
 46
46 -
 47
47 -
 48
48 -
 49
49 -
 50
50 -
 51
51 -
 52
52 -
 53
53 -
 54
54 -
 55
55 -
 56
56 -
 57
57 -
58
-
59
-
60
-
61
-
62
-
63
-
64
-
65
-
66
-
67
-
68
-
69
-
70
-
71
-
72
-
73
-
74
-
75
-
76
-
77
-
78
-
79
-
80
-
81
-
82
-
83
-
84
-
85
-
86
-
87
-
88
-
89
-
90
-
91
-
92
-
93
-
94
-
95
-
96
-
97
-
98
-
99
-
100
-
101
-
102
-
103
-
104
-
105
-
106
-
107
-
108
-
109
-
110
-
111
-
112
-
113
-
114
-
115
-
116
-
117
-
118
-
119
-
120
-
121
-
122
-
123
-
124
-
125
-
126
-
127
-
128
-
129
-
130
-
131
-
132
-
133
-
134
-
135
-
136
-
137
-
138
-
139
-
140
-
141
-
142
-
143
-
144
-
145
-
146
-
147
-
148
-
149
-
150
-
151
-
152
-
153
-
154
-
155
-
156
-
157
-
158
 |
 |

47
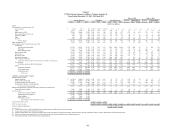
Mortgage banking income totaled $840 million in 2012 compared to $436 million in 2011. The increase in mortgage banking
income was primarily due to an increase in residential mortgage production revenues totaling $378 million, which was driven
by higher gains on residential mortgage production and sales. Included in mortgage banking income for 2012 is a negative
valuation adjustment of $32 million related to changes in assumptions for residential MSRs that are carried at fair value.
Approximately $22 million of the decline in the valuation of the residential MSRs was due to a revision in the servicing cost
assumption based on an expectation of higher costs that continue to impact the industry. The remainder of the net decrease is
primarily due to the impact of an increase in OAS assumption changes partially offset by prepayment speed changes, which
are reflective of the current MSR market. This decrease was more than offset by gains of $128 million from derivative
financial instruments used to manage the economic risk.
Service charges on deposit accounts totaled $566 million in 2012, essentially flat compared to the prior year, reflecting the
impact of pricing changes for routine services related to retail and commercial transaction deposit products, such as monthly
maintenance fees and commercial transaction deposit products, implemented in 2012 and 2011 that were designed to offset a
reduction in service charges that occurred in 2011 and 2010 as a result of a change in overdraft policies.
Investment banking and brokerage fees and commissions increased $32 million, or 9.6%, compared to 2011. This increase
was largely driven by a higher level of investment banking activities and higher brokerage fees and commissions. Checkcard
fees decreased $86 million, or 31.7%, due to the Durbin Amendment to the Dodd-Frank Act, which was implemented on
October 1, 2011 and limited the rate banks could assess for debit card transactions. Bankcard fees and merchant discounts
increased $32 million in 2012, primarily the result of higher volumes for both retail and commercial bankcard activities.
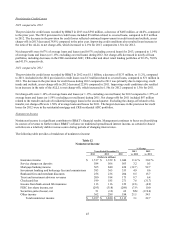
For 2012, noninterest income was reduced by $271 million related to FDIC loss share income, compared to a reduction of
$297 million in 2011. These decreases in income were partially offset by increases of $11 million and $57 million,
respectively, which reflected 80% of the provision for credit losses recorded on covered loans for 2012 and 2011.
BB&T recognized $12 million in net securities losses during 2012, compared to $62 million of net securities gains in 2011.
The net securities losses during 2012 included $9 million of OTTI charges and $3 million of net losses realized from
securities sales. The net securities gains during 2011 included $174 million of net gains realized from securities sales and
$112 million of OTTI charges. The OTTI charges recognized during 2011 were due to weaker actual and forecasted collateral
performance for non-agency RMBS. Refer to the “Analysis of Financial Condition – Investment Activities” section for a
detailed discussion of strategies executed during the years presented.
Other income increased $105 million in 2012 compared to 2011, primarily due to $149 million of losses and write-downs
recorded in 2011 related to the sale of commercial NPLs. This increase was partially offset by $42 million of increased write-
downs on affordable housing investments in 2012 due to revised estimates and processes used to value these investments.
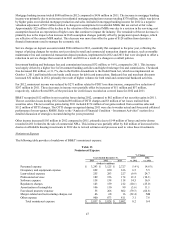
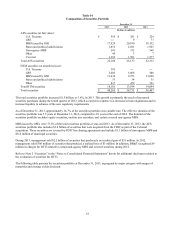
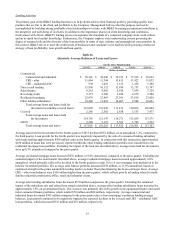
Noninterest Expense
The following table provides a breakdown of BB&T’s noninterest expense:
Table 13
Noninterest Expense
% Change
Years Ended December 31, 2013 2012
2013 2012 2011 vs. 2012 vs. 2011
(Dollars in millions)
Personnel expense $ 3,293 $ 3,125 $ 2,727 5.4 % 14.6 %
Occupancy and equipment expense 692 650 616 6.5 5.5
Loan-related expense 255 283 227 (9.9) 24.7
Professional services 189 156 174 21.2 (10.3)
Software expense 158 138 118 14.5 16.9
Regulatory charges 143 159 212 (10.1) (25.0)
Amortization of intangibles 106 110 99 (3.6) 11.1
Foreclosed property expense 55 266 802 (79.3) (66.8)
Merger-related and restructuring charges, net 46 68 16 (32.4) NM
Other expense 900 873 811 3.1 7.6
Total noninterest expense $ 5,837 $ 5,828 $ 5,802 0.2 0.4