BB&T 2013 Annual Report Download - page 121
Download and view the complete annual report
Please find page 121 of the 2013 BB&T annual report below. You can navigate through the pages in the report by either clicking on the pages listed below, or by using the keyword search tool below to find specific information within the annual report.-
 1
1 -
2
-
3
-
4
-
5
-
6
-
7
-
8
-
9
-
10
-
11
-
12
-
13
-
14
-
15
-
16
-
17
-
18
-
19
-
20
-
21
-
22
-
23
-
24
-
25
-
26
-
27
-
28
-
29
-
30
-
31
-
32
-
33
-
34
-
35
-
36
-
37
-
38
-
39
-
40
-
41
-
42
-
43
-
44
-
45
-
46
-
47
-
48
-
49
-
50
-
51
-
52
-
53
-
54
-
55
-
56
-
57
-
58
-
59
-
60
-
61
-
62
-
63
-
64
-
65
-
66
-
67
-
68
-
69
-
70
-
71
-
72
-
73
-
74
-
75
-
76
-
77
-
78
-
79
-
80
-
81
-
82
-
83
-
84
-
85
-
86
-
87
-
88
-
89
-
90
-
91
-
92
-
93
-
94
-
95
-
96
-
97
-
98
-
99
-
100
-
101
-
102
-
103
-
104
-
105
-
106
-
107
-
108
-
109
-
110
-
 111
111 -
 112
112 -
 113
113 -
 114
114 -
 115
115 -
 116
116 -
 117
117 -
 118
118 -
 119
119 -
 120
120 -
 121
121 -
 122
122 -
 123
123 -
 124
124 -
 125
125 -
 126
126 -
 127
127 -
 128
128 -
 129
129 -
 130
130 -
 131
131 -
132
-
133
-
134
-
135
-
136
-
137
-
138
-
139
-
140
-
141
-
142
-
143
-
144
-
145
-
146
-
147
-
148
-
149
-
150
-
151
-
152
-
153
-
154
-
155
-
156
-
157
-
158
 |
 |

121
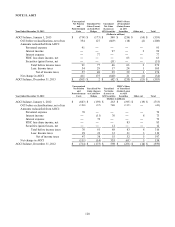
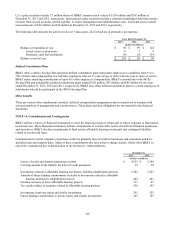
Year Ended December 31, 2011
Unrecognized
Net Pension
and
Postretirement
Costs
Unrealized Net
Gains (Losses)
on Cash Flow
Hedges
Unrealized
Net Gains
(Losses) on
AFS Securities
FDIC's Share
of Unrealized
(Gains) Losses
on AFS
Securities Other, net Total
(Dollars in millions)
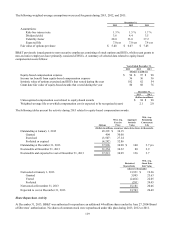
AOCI balance, January 1, 2011 $ (368) $ (47) $ (157) $ (176) $ 1 $ (747)
Transfers ― ― 21 ― (21) ―
OCI before reclassifications, net of tax (256) (141) 440 (50) (3) (10)
Amounts reclassified from AOCI:
Personnel expense 34 ― ― ― ― 34
Interest income ― (26) (4) ― 6 (24)
Interest expense ― 72 ― ― ― 72
FDIC loss share income, net ― ― ― 50 ― 50
Securities (gains) losses, net ― ― (62) ― ― (62)
Total before income taxes 34 46 (66) 50 6 70
Less: Income taxes 13 17 (25) 19 2 26
N
et of income taxes 21 29 (41) 31 4 44
N
et change in AOCI (235) (112) 420 (19) (20) 34
AOCI balance, December 31, 2011 $ (603) $ (159) $ 263 $ (195) $ (19) $ (713)
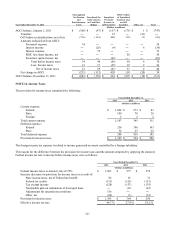
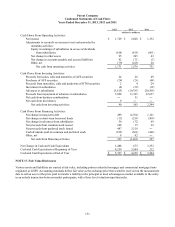
NOTE 12. Income Taxes
The provision for income taxes comprised the following:
Years Ended December 31,
2013 2012 2011
(Dollars in millions)
Current expense:
Federal $ 1,004 $ 273 $ 83
State 100 70 26
Foreign 3 2 2
Total current expense 1,107 345 111
Deferred expense:
Federal 256 396 163
State 32 23 22
Total deferred expense 288 419 185
Provision for income taxes $ 1,395 $ 764 $ 296
The foreign income tax expense is related to income generated on assets controlled by a foreign subsidiary.
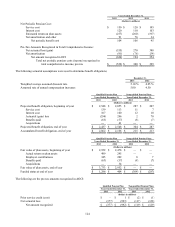
The reasons for the difference between the provision for income taxes and the amount computed by applying the statutory
Federal income tax rate to income before income taxes were as follows:
Years Ended December 31,
2013 2012 2011
(Dollars in millions)
Federal income taxes at statutory rate of 35% $ 1,093 $ 977 $ 570
Increase (decrease) in provision for income taxes as a result of:
State income taxes, net of Federal tax benefit 86 61 31
Federal tax credits (152) (126) (115)
Tax exempt income (128) (133) (135)
N
ontaxable gain on termination of leveraged lease ― (12) (22)
Adjustments for uncertain tax positions 516 ― ―
Other, net (20) (3) (33)
Provision for income taxes $ 1,395 $ 764 $ 296
Effective income tax rate 44.7 % 27.4 % 18.2 %