BB&T 2013 Annual Report Download - page 76
Download and view the complete annual report
Please find page 76 of the 2013 BB&T annual report below. You can navigate through the pages in the report by either clicking on the pages listed below, or by using the keyword search tool below to find specific information within the annual report.-
 1
1 -
2
-
3
-
4
-
5
-
6
-
7
-
8
-
9
-
10
-
11
-
12
-
13
-
14
-
15
-
16
-
17
-
18
-
19
-
20
-
21
-
22
-
23
-
24
-
25
-
26
-
27
-
28
-
29
-
30
-
31
-
32
-
33
-
34
-
35
-
36
-
37
-
38
-
39
-
40
-
41
-
42
-
43
-
44
-
45
-
46
-
47
-
48
-
49
-
50
-
51
-
52
-
53
-
54
-
55
-
56
-
57
-
58
-
59
-
60
-
61
-
62
-
63
-
64
-
65
-
 66
66 -
 67
67 -
 68
68 -
 69
69 -
 70
70 -
 71
71 -
 72
72 -
 73
73 -
 74
74 -
 75
75 -
 76
76 -
 77
77 -
 78
78 -
 79
79 -
 80
80 -
 81
81 -
 82
82 -
 83
83 -
 84
84 -
 85
85 -
 86
86 -
87
-
88
-
89
-
90
-
91
-
92
-
93
-
94
-
95
-
96
-
97
-
98
-
99
-
100
-
101
-
102
-
103
-
104
-
105
-
106
-
107
-
108
-
109
-
110
-
111
-
112
-
113
-
114
-
115
-
116
-
117
-
118
-
119
-
120
-
121
-
122
-
123
-
124
-
125
-
126
-
127
-
128
-
129
-
130
-
131
-
132
-
133
-
134
-
135
-
136
-
137
-
138
-
139
-
140
-
141
-
142
-
143
-
144
-
145
-
146
-
147
-
148
-
149
-
150
-
151
-
152
-
153
-
154
-
155
-
156
-
157
-
158
 |
 |

76
Beta represents the correlation between overall market interest rates and the rates paid by BB&T on interest-bearing deposits.
BB&T applies an average beta of approximately 80% to its managed rate deposits for determining its interest rate sensitivity.
Managed rate deposits are high beta, premium money market and interest checking accounts, which attract significant client
funds when needed to support balance sheet growth. BB&T regularly conducts sensitivity on other key variables to determine
the impact they could have on the interest rate risk position. This allows BB&T to evaluate the likely impact on its balance
sheet management strategies due to a more extreme variation in a key assumption than expected.
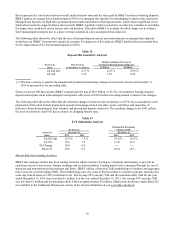
The following table shows the effect that the loss of demand deposits and an associated increase in managed rate deposits
would have on BB&T’s interest-rate sensitivity position. For purposes of this analysis, BB&T modeled the incremental beta
for the replacement of the lost demand deposits at 100%.
Table 32
Deposit Mix Sensitivity Analysis
Results Assuming a Decrease in
Increase in Base Scenario Noninterest Bearing Demand Deposits
Rates at December 31, 2013 (1) $1 Billion $5 Billion
Up 200 bps 2.27 % 2.01 % 0.98 %
Up 100 1.35 1.19 0.56
(1) The base scenario is equal to the annualized hypothetical percentage change in net interest income at December 31,
2013 as presented in the preceding table.
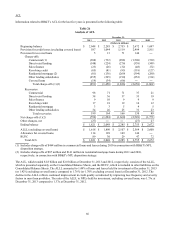
If rates increased 200 basis points, BB&T could absorb the loss of $8.8 billion, or 25.3%, of noninterest bearing demand
deposits and replace them with managed rate deposits with a beta of 100% before becoming neutral to interest rate changes.
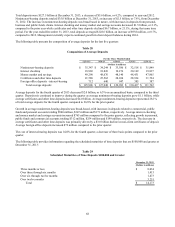
The following table shows the effect that the indicated changes in interest rates would have on EVE. Key assumptions in the
preparation of the table include prepayment speeds of mortgage-related and other assets, cash flows and maturities of
derivative financial instruments, loan volumes and pricing and deposit sensitivity. The resulting change in the EVE reflects
the level of sensitivity that EVE has in relation to changing interest rates.
Table 33
EVE Simulation Analysis
Hypothetical Percentage
EVE/Assets Change in EVE
Change in December 31, December 31,
Rates 2013 2012 2013 2012
Up 200 bps 10.3 % 7.5 % (4.5)% 16.6 %
Up 100 10.6 7.2 (1.4) 11.9
No Change 10.8 6.4 ― ―
Down 25 10.8 6.2 (0.4) (4.1)
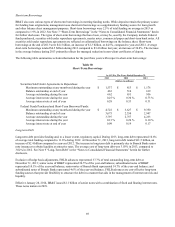
Market Risk from Trading Activities
BB&T also manages market risk from trading activities which consists of acting as a financial intermediary to provide its
customers access to derivatives, foreign exchange and securities markets. Trading market risk is managed through the use of
statistical and non-statistical risk measures and limits. BB&T utilizes a historical VaR methodology to measure and aggregate
risks across its covered trading LOBs. This methodology uses two years of historical data to estimate economic outcomes for
a one-day time horizon at a 99% confidence level. The average 99% one-day VaR and the maximum daily VaR for the year
ended December 31, 2013 were less than $1 million. For the year ended December 31, 2012, the average 99% one-day VaR
was less than $1 million and the maximum daily VaR was approximately $3 million. Market risk disclosures under Basel II.5
are available in the Additional Disclosures section of the Investor Relations site on www.bbt.com/about.