Philips 2008 Annual Report Download - page 106
Download and view the complete annual report
Please find page 106 of the 2008 Philips annual report below. You can navigate through the pages in the report by either clicking on the pages listed below, or by using the keyword search tool below to find specific information within the annual report.-
 1
1 -
2
-
3
-
4
-
5
-
6
-
7
-
8
-
9
-
10
-
11
-
12
-
13
-
14
-
15
-
16
-
17
-
18
-
19
-
20
-
21
-
22
-
23
-
24
-
25
-
26
-
27
-
28
-
29
-
30
-
31
-
32
-
33
-
34
-
35
-
36
-
37
-
38
-
39
-
40
-
41
-
42
-
43
-
44
-
45
-
46
-
47
-
48
-
49
-
50
-
51
-
52
-
53
-
54
-
55
-
56
-
57
-
58
-
59
-
60
-
61
-
62
-
63
-
64
-
65
-
66
-
67
-
68
-
69
-
70
-
71
-
72
-
73
-
74
-
75
-
76
-
77
-
78
-
79
-
80
-
81
-
82
-
83
-
84
-
85
-
86
-
87
-
88
-
89
-
90
-
91
-
92
-
93
-
94
-
95
-
 96
96 -
 97
97 -
 98
98 -
 99
99 -
 100
100 -
 101
101 -
 102
102 -
 103
103 -
 104
104 -
 105
105 -
 106
106 -
 107
107 -
 108
108 -
 109
109 -
 110
110 -
 111
111 -
 112
112 -
 113
113 -
 114
114 -
 115
115 -
 116
116 -
117
-
118
-
119
-
120
-
121
-
122
-
123
-
124
-
125
-
126
-
127
-
128
-
129
-
130
-
131
-
132
-
133
-
134
-
135
-
136
-
137
-
138
-
139
-
140
-
141
-
142
-
143
-
144
-
145
-
146
-
147
-
148
-
149
-
150
-
151
-
152
-
153
-
154
-
155
-
156
-
157
-
158
-
159
-
160
-
161
-
162
-
163
-
164
-
165
-
166
-
167
-
168
-
169
-
170
-
171
-
172
-
173
-
174
-
175
-
176
-
177
-
178
-
179
-
180
-
181
-
182
-
183
-
184
-
185
-
186
-
187
-
188
-
189
-
190
-
191
-
192
-
193
-
194
-
195
-
196
-
197
-
198
-
199
-
200
-
201
-
202
-
203
-
204
-
205
-
206
-
207
-
208
-
209
-
210
-
211
-
212
-
213
-
214
-
215
-
216
-
217
-
218
-
219
-
220
-
221
-
222
-
223
-
224
-
225
-
226
-
227
-
228
-
229
-
230
-
231
-
232
-
233
-
234
-
235
-
236
-
237
-
238
-
239
-
240
-
241
-
242
-
243
-
244
-
245
-
246
-
247
-
248
-
249
-
250
-
251
-
252
-
253
-
254
-
255
-
256
-
257
-
258
-
259
-
260
-
261
-
262
-
263
-
264
-
265
-
266
-
267
-
268
-
269
-
270
-
271
-
272
-
273
-
274
-
275
-
276
 |
 |
Details of pension risks
This section further analyzes the pension exposure
and possible risks thereof.
Pension-related exposure to changes in
financial markets
With pension obligations in more than thirty countries,
Philips has devoted considerable attention and resources
to ensuring disclosure, awareness and control of the
resulting exposures.
Depending on the investment policies and the
membership composition of the respective pension
funds, developments in financial markets and changes
in life expectancy may have significant effects on the
Funded Status and net periodic pension costs (NPPC)
of Philips’ pension plans. To monitor their exposure
to the respective risk factors, Philips uses a stochastic
model that covers approximately 95% of the company’s
total pension liabilities and contains separate modules
for Germany, the Netherlands, the UK and the US.
Amongst other things, it allows both sensitivity
analysis and stochastic simulations of the pension
accounting figures of Philips.
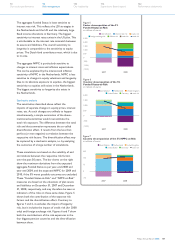
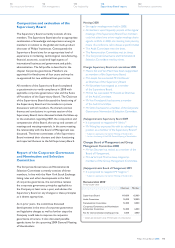
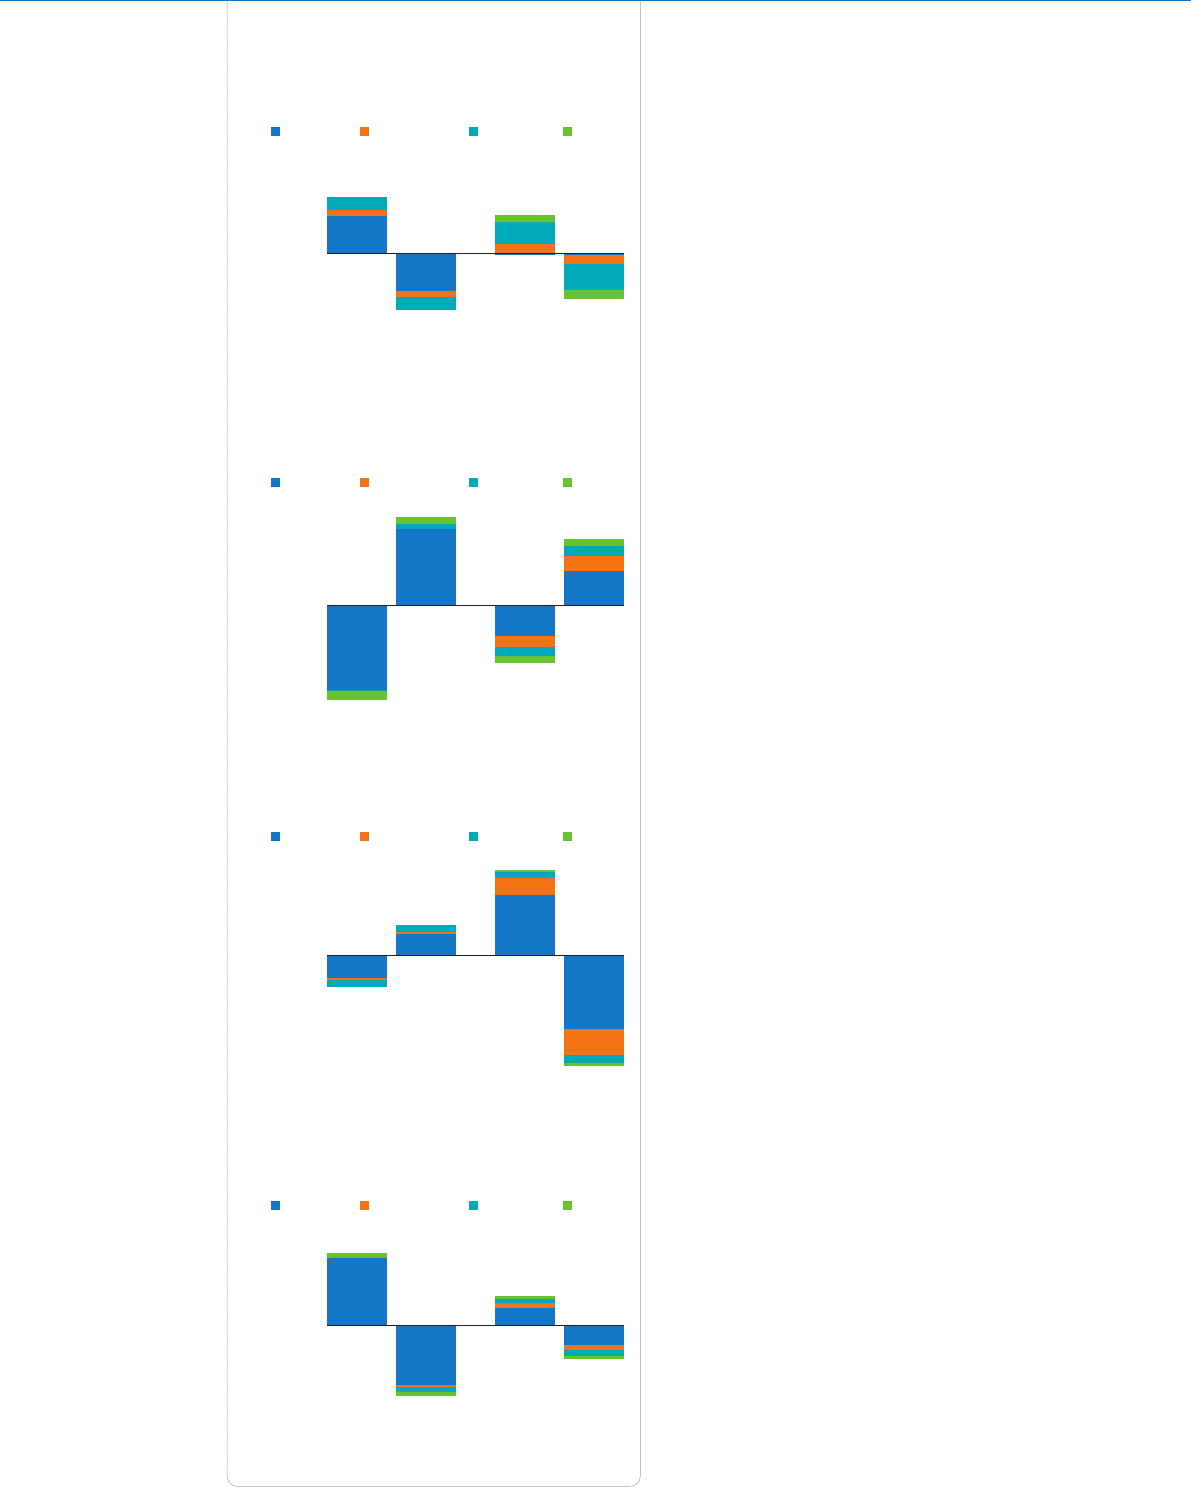
Sensitivity analysis
An indication of Philips’ risk exposures can be obtained
by a sensitivity analysis of the Funded Status and NPPC
for the above-mentioned countries. The bar charts in
figures 1 and 2 show the sensitivities of the Funded
Status to changes in equity valuations, interest rates,
inflation expectations and longevity. Figures 3 and 4
show the same sensitivities for the NPPC. The risk
numbers show the extent to which the Funded Status
and NPPC deviate from their (expected) levels as per
year-end 2009 if equity price levels, interest rates,
inflation and longevity deviate one standard deviation
from their (expected) values at the end of 2009.
The aggregate Funded Status is particularly sensitive
to changes in inflation expectations. This is attributable
to the inflation sensitivity of the projected pension
obligations (PBO) for the Netherlands, which is not
matched by inflation-sensitive assets. The sensitivity to
changes in equity valuations is also dominated by the
sensitivity in the Netherlands, even though in relative
terms there is a bigger exposure in the US. There is
no sensitivity to equity prices left in Germany, where
equity holdings were swapped for cash and fixed
income assets in 2008 in anticipation of the
implementation of a liability-driven investment
(LDI) strategy in 2009.
Figure 1
Sensitivity of funded status to equity
and interest rates
in millions of euros
Impact on funded status
(1,000)
(750)
(500)
(250)
500
250
0
750
1,000
Equity Interest rate
United KingdomNetherlands United States Germany
Figure 2
Sensitivity of funded status to inflation and longevity
in millions of euros
Impact on funded status
(1,000)
(750)
(500)
(250)
500
250
0
750
1,000
Inflation expectation Longevity
United KingdomNetherlands United States Germany
Figure 3
Sensitivity of NPPC to equity and interest rates
in millions of euros
Impact on NPPC
(150)
(75)
(100)
(125)
(50)
(25)
50
25
0
75
100
125
Equity Interest rate
United KingdomNetherlands United States Germany
Figure 4
Sensitivity of NPPC to inflation and longevity
in millions of euros
Impact on NPPC
(150)
(75)
(100)
(125)
(50)
(25)
50
25
0
75
100
125
Inflation expectation Longevity
United KingdomNetherlands United States Germany
Philips Annual Report 2008106
42
Our group performance
18
We care about...
8
Message from
the President
6
Performance highlights
14
Who we are