Philips 2008 Annual Report Download - page 155
Download and view the complete annual report
Please find page 155 of the 2008 Philips annual report below. You can navigate through the pages in the report by either clicking on the pages listed below, or by using the keyword search tool below to find specific information within the annual report.-
 1
1 -
2
-
3
-
4
-
5
-
6
-
7
-
8
-
9
-
10
-
11
-
12
-
13
-
14
-
15
-
16
-
17
-
18
-
19
-
20
-
21
-
22
-
23
-
24
-
25
-
26
-
27
-
28
-
29
-
30
-
31
-
32
-
33
-
34
-
35
-
36
-
37
-
38
-
39
-
40
-
41
-
42
-
43
-
44
-
45
-
46
-
47
-
48
-
49
-
50
-
51
-
52
-
53
-
54
-
55
-
56
-
57
-
58
-
59
-
60
-
61
-
62
-
63
-
64
-
65
-
66
-
67
-
68
-
69
-
70
-
71
-
72
-
73
-
74
-
75
-
76
-
77
-
78
-
79
-
80
-
81
-
82
-
83
-
84
-
85
-
86
-
87
-
88
-
89
-
90
-
91
-
92
-
93
-
94
-
95
-
96
-
97
-
98
-
99
-
100
-
101
-
102
-
103
-
104
-
105
-
106
-
107
-
108
-
109
-
110
-
111
-
112
-
113
-
114
-
115
-
116
-
117
-
118
-
119
-
120
-
121
-
122
-
123
-
124
-
125
-
126
-
127
-
128
-
129
-
130
-
131
-
132
-
133
-
134
-
135
-
136
-
137
-
138
-
139
-
140
-
141
-
142
-
143
-
144
-
 145
145 -
 146
146 -
 147
147 -
 148
148 -
 149
149 -
 150
150 -
 151
151 -
 152
152 -
 153
153 -
 154
154 -
 155
155 -
 156
156 -
 157
157 -
 158
158 -
 159
159 -
 160
160 -
 161
161 -
 162
162 -
 163
163 -
 164
164 -
 165
165 -
166
-
167
-
168
-
169
-
170
-
171
-
172
-
173
-
174
-
175
-
176
-
177
-
178
-
179
-
180
-
181
-
182
-
183
-
184
-
185
-
186
-
187
-
188
-
189
-
190
-
191
-
192
-
193
-
194
-
195
-
196
-
197
-
198
-
199
-
200
-
201
-
202
-
203
-
204
-
205
-
206
-
207
-
208
-
209
-
210
-
211
-
212
-
213
-
214
-
215
-
216
-
217
-
218
-
219
-
220
-
221
-
222
-
223
-
224
-
225
-
226
-
227
-
228
-
229
-
230
-
231
-
232
-
233
-
234
-
235
-
236
-
237
-
238
-
239
-
240
-
241
-
242
-
243
-
244
-
245
-
246
-
247
-
248
-
249
-
250
-
251
-
252
-
253
-
254
-
255
-
256
-
257
-
258
-
259
-
260
-
261
-
262
-
263
-
264
-
265
-
266
-
267
-
268
-
269
-
270
-
271
-
272
-
273
-
274
-
275
-
276
 |
 |

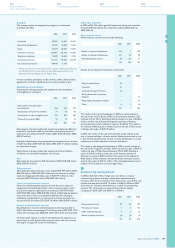
8
Earnings per share
The earnings per share (EPS) data have been calculated as follows:
2006 2007 2008
Net income (loss)
Income (loss) from continuing operations 899 4,593 (178)
Income (loss) from discontinued operations 4,482 (433) (8)
Net income (loss) attributable to holders
of common shares 5,381 4,160 (186)
Weighted average number of shares 1,174,924,579 1,086,128,418 991,420,017
Plus incremental shares from assumed conversions of:
Options and restricted share rights 6,817,690 10,203,409 6,099,113
Convertible debentures 1,042,061 1,103,117 200,904
Dilutive potential common shares 7,859,751 11,306,526 6,300,017
Adjusted weighted average number of shares 1,182,784,330 1,097,434,944 997,720,034
Basic earnings per share in euros
Income (loss) from continuing operations 0.77 4.23 (0.18)
Income (loss) from discontinued operations 3.81 (0.40) (0.01)
Net income (loss) 4.58 3.83 (0.19)
Diluted earnings per share in euros
Income (loss) from continuing operations 0.76 4.19 (0.18)1)
Income (loss) from discontinued operations 3.79 (0.40) (0.01)1)
Net income (loss) 4.55 3.79 (0.19)1)
In 2008, 2007 and 2006, respectively 48 million, 27 million and 19 million securities that could potentially dilute basic EPS were not included in the computation
of dilutive EPS because the effect would have been antidilutive for the periods presented.
In 2008, the incremental shares from assumed conversion are not taken into account as the effect would be antidilutive.
1)
8
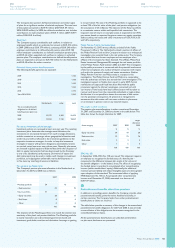
9
Receivables
Income taxes receivable (current portion) totaling EUR 133 million
(2007: EUR 52 million) are included under other receivables.
The changes in the allowance for doubtful accounts receivable are
as follows:
2006 2007 2008
Balance as of January 1 369 336 300
Additions charged to income 52 62 33
Deductions from allowance1) (72) (85) (63)
Other movements2) (13) (13) 10
Balance as of December 31 336 300 280
Write-offs for which an allowance was previously provided
1)
Including the effect of translation differences and consolidation changes
2)
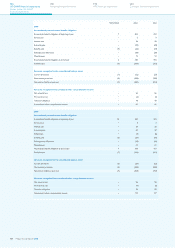
9
10
Inventories
Inventories are summarized as follows:
2007 2008
Raw materials and supplies 908 976
Work in process 391 530
Finished goods 1,968 2,066
Advance payments on work in process (121) (201)
3,146 3,371
The amounts recorded above are net of allowances for obsolescence.
As of December 31, 2008, the carrying amount of inventories carried
at fair value less cost-to-sell is EUR 257 million (2007: EUR 190 million).
As discussed under Significant accounting policies, Reclassification
and revisions, the previously reported inventories balance as of
December 31, 2007 was revised downwards by EUR 57 million
to reflect immaterial adjustments of intercompany profit eliminations
on inventories.
11
Other current assets
Other current assets consist of a current deferred tax asset of
EUR 837 million (2007: EUR 399 million), derivative instruments
of EUR 253 million (2007: EUR 275 million), prepaid expenses of
EUR 375 million (2007: EUR 346 million) and other current financial
assets of EUR 121 million (2007: EUR nil).
10
11
Philips Annual Report 2008 155
254
Corporate governance
250
Reconciliation of
non-US GAAP information
262
Ten-year overview
266
Investor information