Philips 2008 Annual Report Download - page 242
Download and view the complete annual report
Please find page 242 of the 2008 Philips annual report below. You can navigate through the pages in the report by either clicking on the pages listed below, or by using the keyword search tool below to find specific information within the annual report.-
 1
1 -
2
-
3
-
4
-
5
-
6
-
7
-
8
-
9
-
10
-
11
-
12
-
13
-
14
-
15
-
16
-
17
-
18
-
19
-
20
-
21
-
22
-
23
-
24
-
25
-
26
-
27
-
28
-
29
-
30
-
31
-
32
-
33
-
34
-
35
-
36
-
37
-
38
-
39
-
40
-
41
-
42
-
43
-
44
-
45
-
46
-
47
-
48
-
49
-
50
-
51
-
52
-
53
-
54
-
55
-
56
-
57
-
58
-
59
-
60
-
61
-
62
-
63
-
64
-
65
-
66
-
67
-
68
-
69
-
70
-
71
-
72
-
73
-
74
-
75
-
76
-
77
-
78
-
79
-
80
-
81
-
82
-
83
-
84
-
85
-
86
-
87
-
88
-
89
-
90
-
91
-
92
-
93
-
94
-
95
-
96
-
97
-
98
-
99
-
100
-
101
-
102
-
103
-
104
-
105
-
106
-
107
-
108
-
109
-
110
-
111
-
112
-
113
-
114
-
115
-
116
-
117
-
118
-
119
-
120
-
121
-
122
-
123
-
124
-
125
-
126
-
127
-
128
-
129
-
130
-
131
-
132
-
133
-
134
-
135
-
136
-
137
-
138
-
139
-
140
-
141
-
142
-
143
-
144
-
145
-
146
-
147
-
148
-
149
-
150
-
151
-
152
-
153
-
154
-
155
-
156
-
157
-
158
-
159
-
160
-
161
-
162
-
163
-
164
-
165
-
166
-
167
-
168
-
169
-
170
-
171
-
172
-
173
-
174
-
175
-
176
-
177
-
178
-
179
-
180
-
181
-
182
-
183
-
184
-
185
-
186
-
187
-
188
-
189
-
190
-
191
-
192
-
193
-
194
-
195
-
196
-
197
-
198
-
199
-
200
-
201
-
202
-
203
-
204
-
205
-
206
-
207
-
208
-
209
-
210
-
211
-
212
-
213
-
214
-
215
-
216
-
217
-
218
-
219
-
220
-
221
-
222
-
223
-
224
-
225
-
226
-
227
-
228
-
229
-
230
-
231
-
 232
232 -
 233
233 -
 234
234 -
 235
235 -
 236
236 -
 237
237 -
 238
238 -
 239
239 -
 240
240 -
 241
241 -
 242
242 -
 243
243 -
 244
244 -
 245
245 -
 246
246 -
 247
247 -
 248
248 -
 249
249 -
 250
250 -
 251
251 -
 252
252 -
253
-
254
-
255
-
256
-
257
-
258
-
259
-
260
-
261
-
262
-
263
-
264
-
265
-
266
-
267
-
268
-
269
-
270
-
271
-
272
-
273
-
274
-
275
-
276
 |
 |

68
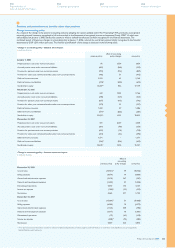
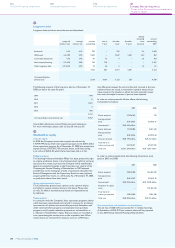
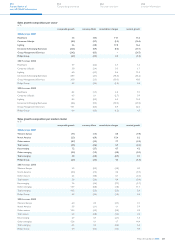
Fair value of financial assets and liabilities
The estimated fair value of financial instruments has been determined
by the Company using available market information and appropriate
valuation methods. The estimates presented are not necessarily
indicative of the amounts that will ultimately be realized by the
Company upon maturity or disposal. The use of different market
assumptions and/or estimation methods may have a material effect
on the estimated fair value amounts.
December 31, 2007 December 31, 2008
carrying
amount
estimated
fair value
carrying
amount
estimated
fair value
Assets
Cash and cash equivalents 8,769 8,769 3,620 3,620
Accounts receivable -
current 4,670 4,670 4,289 4,289
Accounts receivable -
non-current 78 78 47 47
Other non-current financial
assets excluding
cost-method investments 2,156 2,156 980 980
Main listed investments in
equity-accounted investees 1,638 2,688 60 60
Derivative instruments -
assets 275 275 253 253
Other current financial
assets −−121 121
Liabilities
Accounts payable (3,372) (3,372) (2,992) (2,992)
Debt (3,563) (3,646) (4,188) (4,146)
Derivative instruments -
liabilities (144) (144) (505) (505)
The following methods and assumptions were used to estimate
the fair value of financial instruments:
Cash and cash equivalents, accounts receivable - current and
accounts payable
The carrying amounts approximate fair value because of the short
maturity of these instruments.
Other financial assets
For other financial assets, fair value is based upon the estimated
market prices.
Accounts receivable – non-current
The fair value is estimated on the basis of discounted cash flow
analyses.
Debt
The fair value is estimated on the basis of the quoted market prices
for certain issues, or on the basis of discounted cash flow analyses
based upon market rates plus Philips’ spread for the particular tenors
of the borrowing arrangements. Accrued interest is included under
accounts payable and not within the carrying amount or estimated
fair value of debt. At December 31, 2008, accrued interest expenses
were EUR 79 million (2007: EUR 110 million). The accrued interest
on bonds, which is the main part of the accrual, was EUR 70 million
(2007: EUR 99 million).
69
Other financial instruments, derivatives
and currency risk
The Company does not purchase or hold financial derivative
instruments for trading purposes. Assets and liabilities related to
derivative instruments are disclosed in note 47, note 48 and note 54
respectively. Currency fluctuations may impact Philips’ financial results.
The Company is exposed to currency risk in the following areas:
Transaction exposures, such as forecasted sales and purchases,
•
and on-balance-sheet receivables or payables resulting from such
transactions;
Translation exposure of net income in foreign entities;
•
Translation exposure of foreign-currency intercompany and •
external debt and deposits;
Translation exposure of equity invested in consolidated foreign
•
entities; and
Exposure to equity interests in non-functional-currency
•
equity-accounted-investees and available-for-sale investments.
It is Philips’ policy that significant transaction exposures are hedged.
The Philips policy generally requires committed foreign-currency
exposures to be hedged fully using forwards. Anticipated transactions
are hedged using forwards or options or a combination thereof. The
policy for the hedging of anticipated exposures specifying the use of
forwards/options and the hedge tenor varies per business and is a
function of the ability to forecast cash flows and the way in which the
businesses can adapt to changed levels of foreign exchange rates. As a
result, hedging activities may not eliminate all currency risks for these
transaction exposures. Generally, the maximum tenor of these hedges
equals 18 months. The Company does not hedge the exposure arising
from translation exposure of net income in foreign entities. Translation
exposure of equity invested in consolidated foreign entities financed
by equity is partially hedged. If a hedge is entered into, it is accounted
for as a net investment hedge.
The currency of the external funding and deposits of the Company
is matched with the required financing of subsidiaries either directly
by external foreign currency loans and deposits, or by using foreign
exchange swaps. In certain cases where group companies have foreign
currency debt or liquid assets, these exposures are also hedged
through the use of foreign exchange derivatives.
Philips does not currently hedge the foreign exchange exposure
arising from equity-accounted investees and available-for-sale
investments.
The Company uses foreign exchange derivatives to manage its
currency risk. The US dollar and pound sterling account for a high
percentage of the Company’s foreign exchange derivatives.
The Company hedges certain commodity price risks using derivative
instruments to minimize significant, unanticipated earnings
fluctuations caused by commodity price volatility. The commodity
price derivatives that Philips enters into are normally concluded
as cash flow hedges to offset forecasted purchases.
Changes in the value of foreign currency accounts receivable/payable
as well as the changes in the fair value of the hedges of accounts
receivable/payable are reported in the income statement under cost
of sales. The hedges related to forecasted transactions are recorded
as cash flow hedges. The results from such hedges are deferred within
other comprehensive income in stockholders’ equity. Currently, a loss
of EUR 28 million is deferred in stockholders’ equity as a result of
these hedges. During 2008, a loss of EUR 3 million was recorded in
the income statement in the line cost of sales in the line cost of sales
as a result of ineffectiveness of transaction hedges.
Changes in the fair value of hedges related to external and
intercompany debt and deposits are recognized within Financial
income and expenses in the income statement. The changes in the
fair value of these hedges related to foreign exchange movements are
largely offset in the income statement by changes in the fair value of
the hedged items. The Company recorded a gain of EUR 11 million in
other comprehensive income under currency translation differences
as a result of net investment hedges of investments in foreign
subsidiaries during 2008.
Philips Annual Report 2008242
180
Sustainability performance
244
Company financial statements
124
US GAAP financial statements
192
IFRS financial statements
Notes to the IFRS financial
statements