Philips 2008 Annual Report Download - page 92
Download and view the complete annual report
Please find page 92 of the 2008 Philips annual report below. You can navigate through the pages in the report by either clicking on the pages listed below, or by using the keyword search tool below to find specific information within the annual report.-
 1
1 -
2
-
3
-
4
-
5
-
6
-
7
-
8
-
9
-
10
-
11
-
12
-
13
-
14
-
15
-
16
-
17
-
18
-
19
-
20
-
21
-
22
-
23
-
24
-
25
-
26
-
27
-
28
-
29
-
30
-
31
-
32
-
33
-
34
-
35
-
36
-
37
-
38
-
39
-
40
-
41
-
42
-
43
-
44
-
45
-
46
-
47
-
48
-
49
-
50
-
51
-
52
-
53
-
54
-
55
-
56
-
57
-
58
-
59
-
60
-
61
-
62
-
63
-
64
-
65
-
66
-
67
-
68
-
69
-
70
-
71
-
72
-
73
-
74
-
75
-
76
-
77
-
78
-
79
-
80
-
81
-
 82
82 -
 83
83 -
 84
84 -
 85
85 -
 86
86 -
 87
87 -
 88
88 -
 89
89 -
 90
90 -
 91
91 -
 92
92 -
 93
93 -
 94
94 -
 95
95 -
 96
96 -
 97
97 -
 98
98 -
 99
99 -
 100
100 -
 101
101 -
 102
102 -
103
-
104
-
105
-
106
-
107
-
108
-
109
-
110
-
111
-
112
-
113
-
114
-
115
-
116
-
117
-
118
-
119
-
120
-
121
-
122
-
123
-
124
-
125
-
126
-
127
-
128
-
129
-
130
-
131
-
132
-
133
-
134
-
135
-
136
-
137
-
138
-
139
-
140
-
141
-
142
-
143
-
144
-
145
-
146
-
147
-
148
-
149
-
150
-
151
-
152
-
153
-
154
-
155
-
156
-
157
-
158
-
159
-
160
-
161
-
162
-
163
-
164
-
165
-
166
-
167
-
168
-
169
-
170
-
171
-
172
-
173
-
174
-
175
-
176
-
177
-
178
-
179
-
180
-
181
-
182
-
183
-
184
-
185
-
186
-
187
-
188
-
189
-
190
-
191
-
192
-
193
-
194
-
195
-
196
-
197
-
198
-
199
-
200
-
201
-
202
-
203
-
204
-
205
-
206
-
207
-
208
-
209
-
210
-
211
-
212
-
213
-
214
-
215
-
216
-
217
-
218
-
219
-
220
-
221
-
222
-
223
-
224
-
225
-
226
-
227
-
228
-
229
-
230
-
231
-
232
-
233
-
234
-
235
-
236
-
237
-
238
-
239
-
240
-
241
-
242
-
243
-
244
-
245
-
246
-
247
-
248
-
249
-
250
-
251
-
252
-
253
-
254
-
255
-
256
-
257
-
258
-
259
-
260
-
261
-
262
-
263
-
264
-
265
-
266
-
267
-
268
-
269
-
270
-
271
-
272
-
273
-
274
-
275
-
276
 |
 |

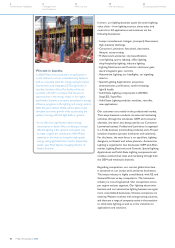
Philips Design
Philips Design is one of the longest-established design
organizations of its kind in the world. It is headquartered
in Eindhoven, Netherlands, with eight branch studios
in Europe, the USA and Asia Pacific. Its creative force
of some 550 professionals – representing more than
30 nationalities – embraces disciplines as diverse
as psychology, cultural sociology, anthropology and
trend research, in addition to the more conventional
design-related skills.
Philips Design’s people-centric design approach, known
as High Design, is human-focused and research-based,
and uses a deep understanding of people’s needs as
the starting point for the design process. It also provides
the framework for taking these insights and translating
them into imaginative yet feasible solutions.
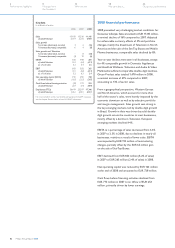
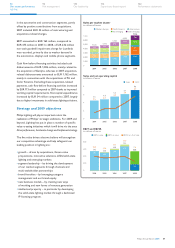
2008 financial performance
In 2008, EBITA amounted to a loss of EUR 226 million,
compared to a loss of EUR 81 million in 2007, which
included a EUR 6 million gain on the sale of TASS.
The higher loss was mainly due to EUR 18 million
restructuring charges at Assembléon, a EUR 13 million
loss from the sale of High Tech Plastics – Optics, as
well as higher investments in the Lighting & Cleantech
and Healthcare Incubator activities and lower income
from an intellectual property transaction in 2007.
Cash flow before financing activities improved by
EUR 38 million to an outflow of EUR 126 million,
largely thanks to higher license income receipts
and lower net capital expenditures, partly offset
by lower proceeds from the sale of businesses.
Key data
in millions of euros
2006 2007 2008
Sales 1,379 535 337
Sales growth
% decrease, nominal (28) (61) (37)
% increase (decrease), comparable
(9) 38 (27)
EBITA Corporate Technologies (91) (76) (172)
EBITA Corporate Investments/ Other
16 (5) (54)
EBITA (75) (81) (226)
as a % of sales (5.4) (15.1) (67.1)
EBIT (76) (82) (226)
as a % of sales (5.5) (15.3) (67.1)
Net operating capital (NOC) 128 246 153
Cash flows before financing activities
(49) (164) (126)
Employees (FTEs) 8,832 5,888 5,324
For a reconciliation to the most directly comparable US GAAP measures,
see the chapter Reconciliation of non-US GAAP information
Philips Annual Report 200892
42
Our group performance
18
We care about...
8
Message from
the President
6
Performance highlights
14
Who we are